On the SHYFT Power app’s dashboard, you can see the site preview in the left panel by clicking a site from the site table.
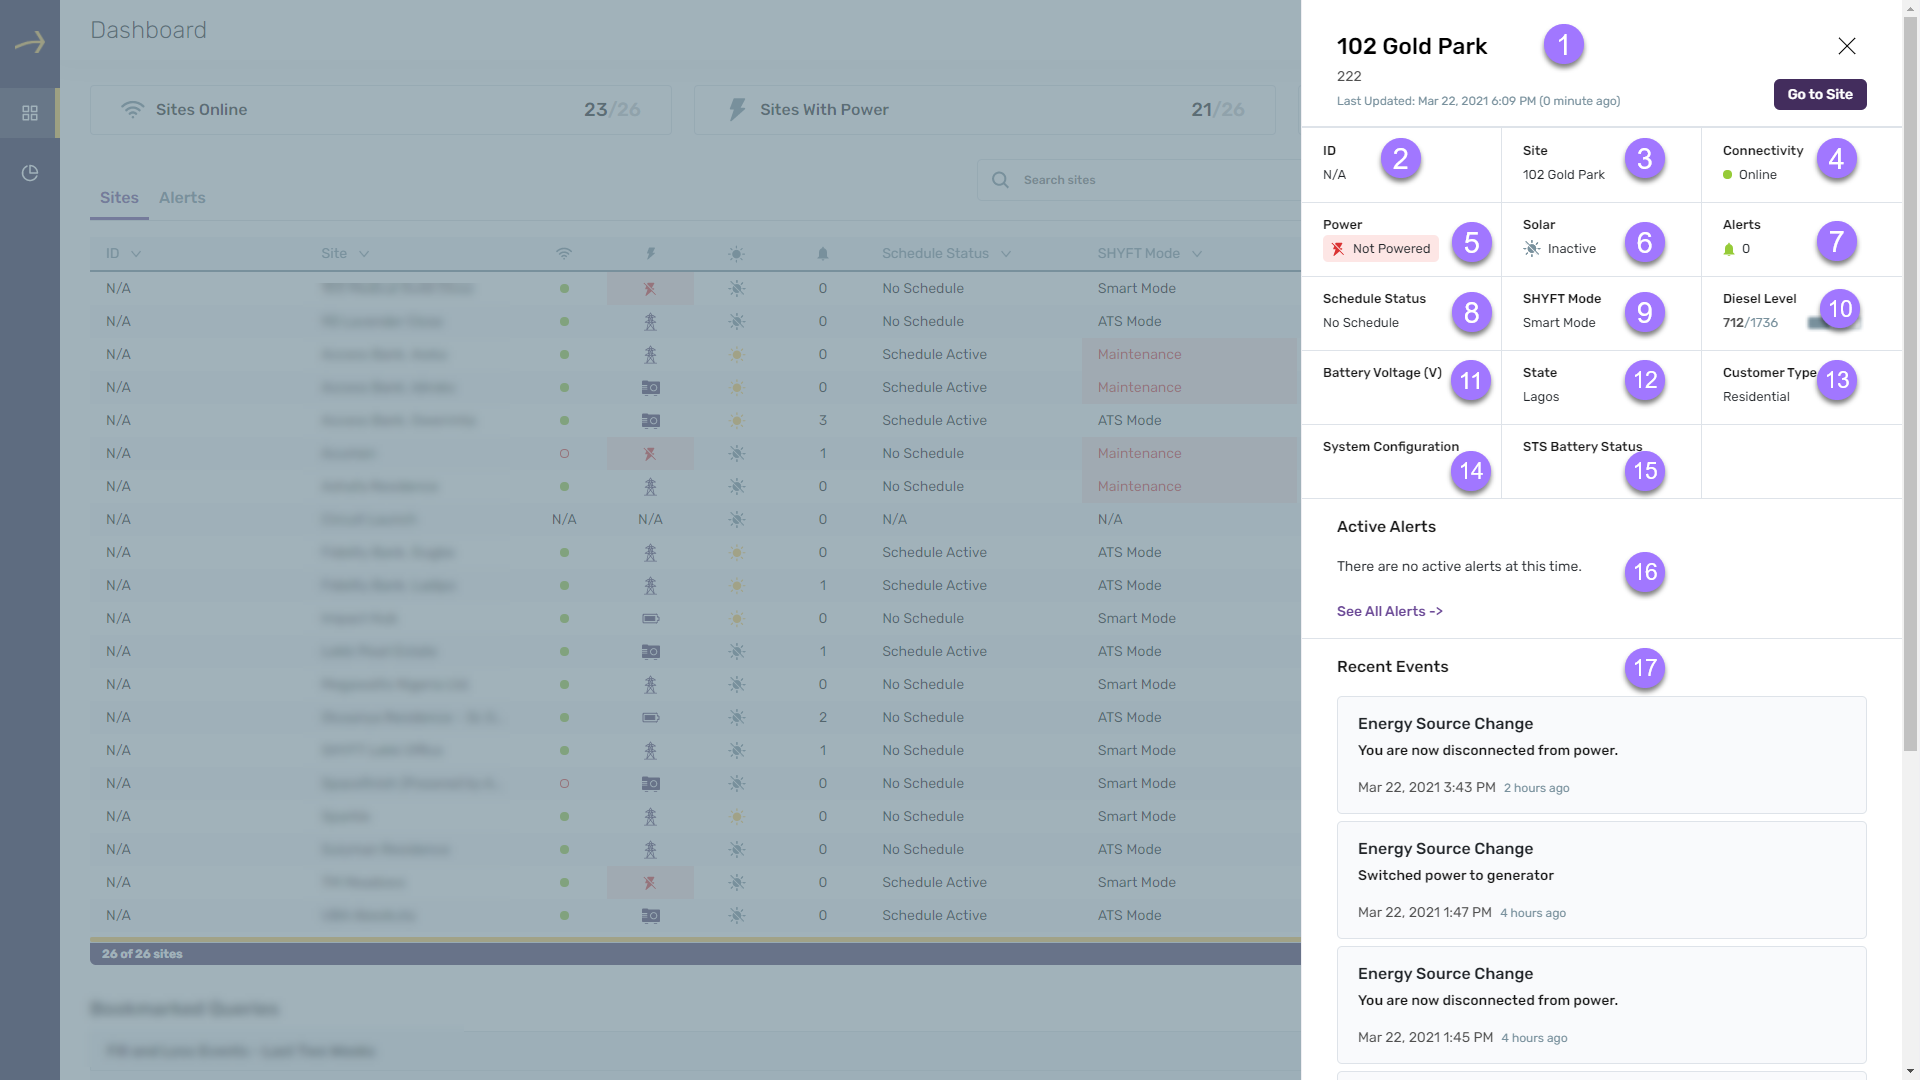
The preview shows the following details related to the site:
- Name of the Site and its internal ID.
- ID of the site added by the customer.
- Site name
- Connectivity status
- Power status
- Solar information
- Number of Active alerts
- Schedule status
- SHYFT Mode
- Diesel level
- Battery Voltage (V)
- State
- Customer Type
- System Configuration
- STS Battery status
- Active alerts list
- Recent events
The preview also shows a button on the top using which a user can navigate to full dashboard related to the respective site where the user will be able to see the following:
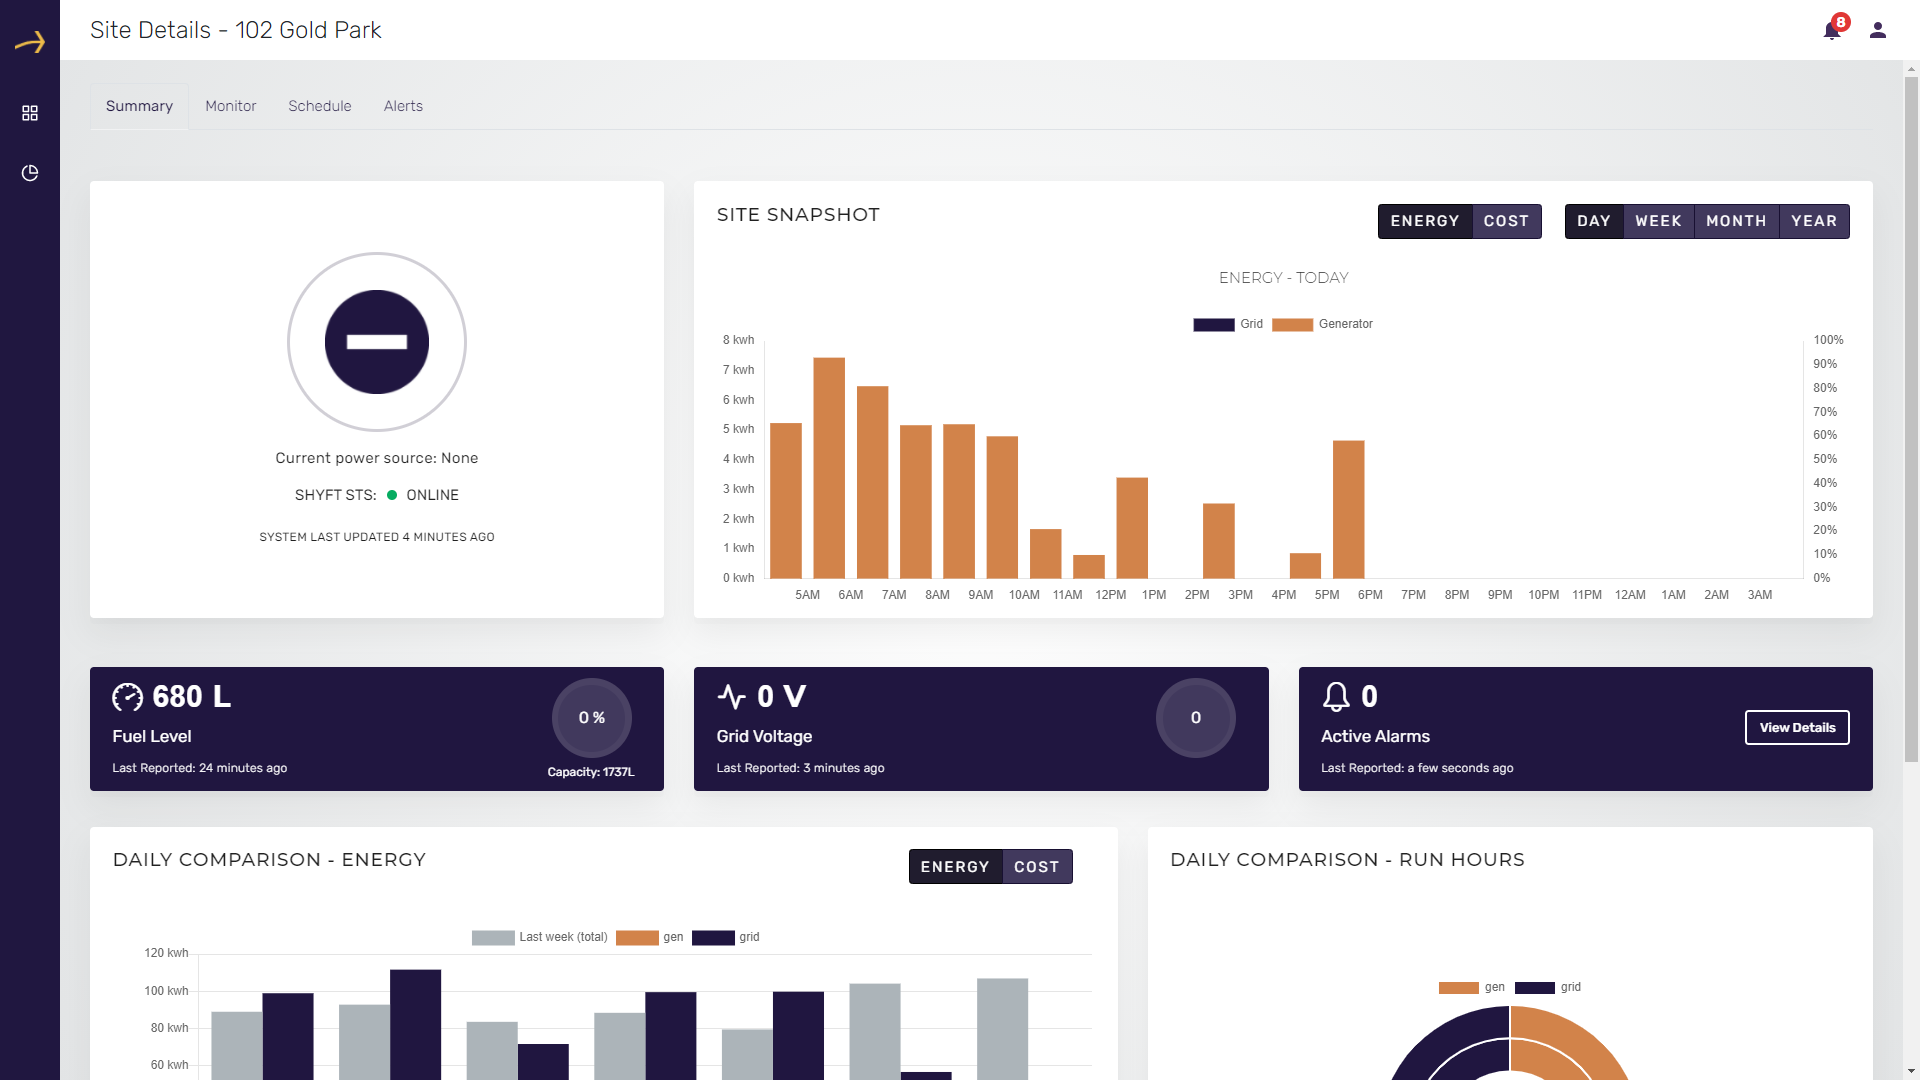
- Summary: The first tab in the full site dashboard is the summary which displays site status, Energy / Cost graph, Fuel level, Grid voltage, Daily comparison of cost and energy, Daily comparison of run hours for generator and grid.
- Monitor: The full dashboard has a second tab titled “Monitor” where a user can monitor various properties related to the site like generator, grid, fuel tank etc, and see the graphical reports on these properties.
- Schedule: There is a third tab in the full dashboard where users can see and add schedules.
- Alerts: The fourth tab in the site dashboard is “Alerts” where users can see active alarms and events.
Detailed Site Dashboard
In the SHYFT Power application you get the detailed dashboard for a site which has various useful information and analytics related to that site. To navigate to a site’s detailed dashboard follow the below steps:
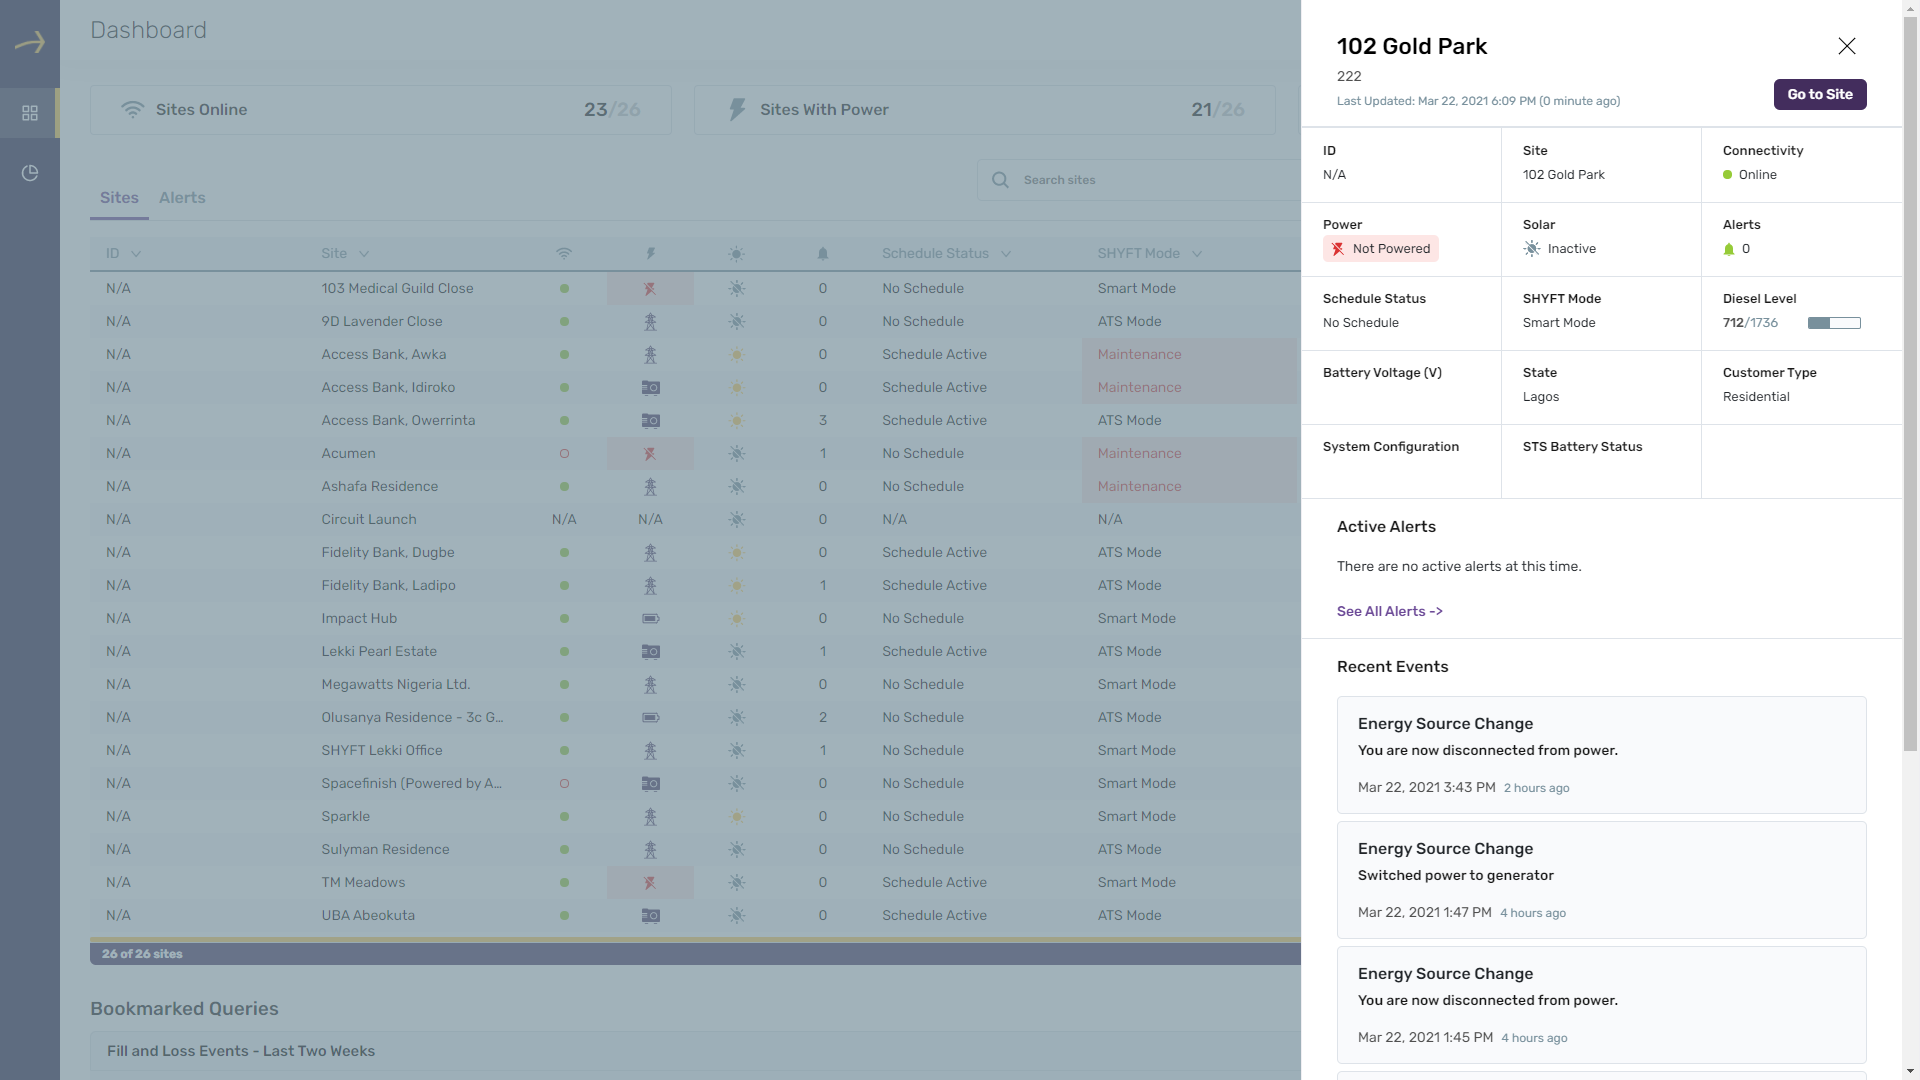
- Login to the SHYFT application
- Navigate to the site dashboard.
- Click on a site from the site table or map available on the dashboard.
- This will open the site snapshot in a panel on the right side.
- Click on the Go To site button from the right panel.
- This will open the dashboard for the respective site.
Here are the different tabs available on the site dashboard:
(1) Summary
The Summary tab on the site dashboard displays site status, Energy / Cost graph, Fuel level, Grid voltage, Daily comparison of cost and energy, Daily comparison of run hours for generator and grid. Mentioned below are the details of each section of the summary tab.
(1.1) Current Power Source and SHYFT STS
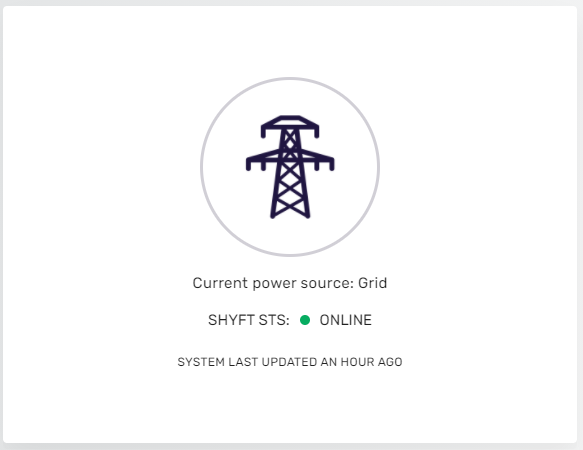
This section displays the current power source whether it is Grid, Generator, Battery or None and SHYFT STS whether it is ONLINE or OFFLINE.
(1.2) SITE SNAPSHOT:
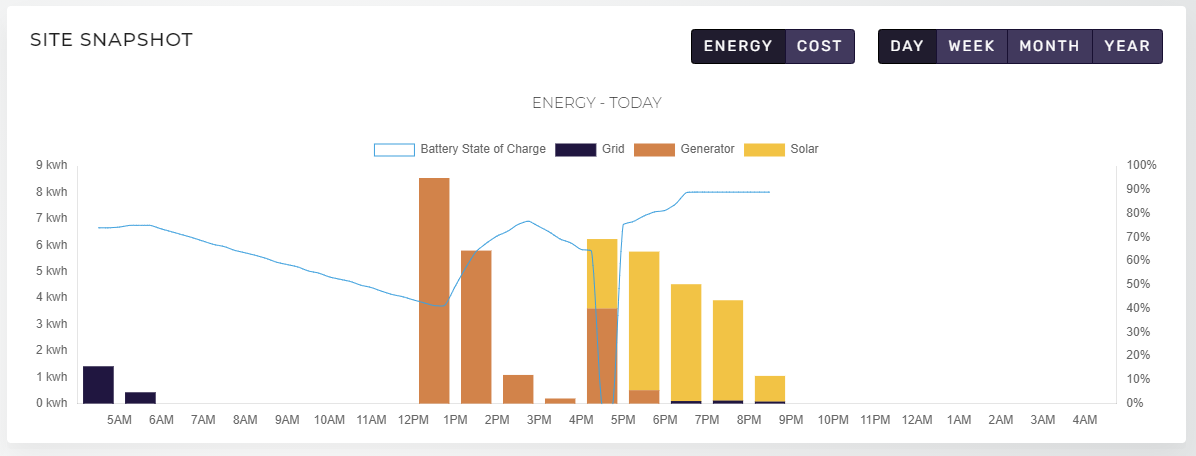
This section displays the energy and cost snapshots by day, week, month and year in a bar graph report. Please check the example in the below screenshot which is displaying the hourly Energy consumption in KWH for a day respective to Grid, Generator and Solar. It also displays the hourly battery state of charge in KWH.
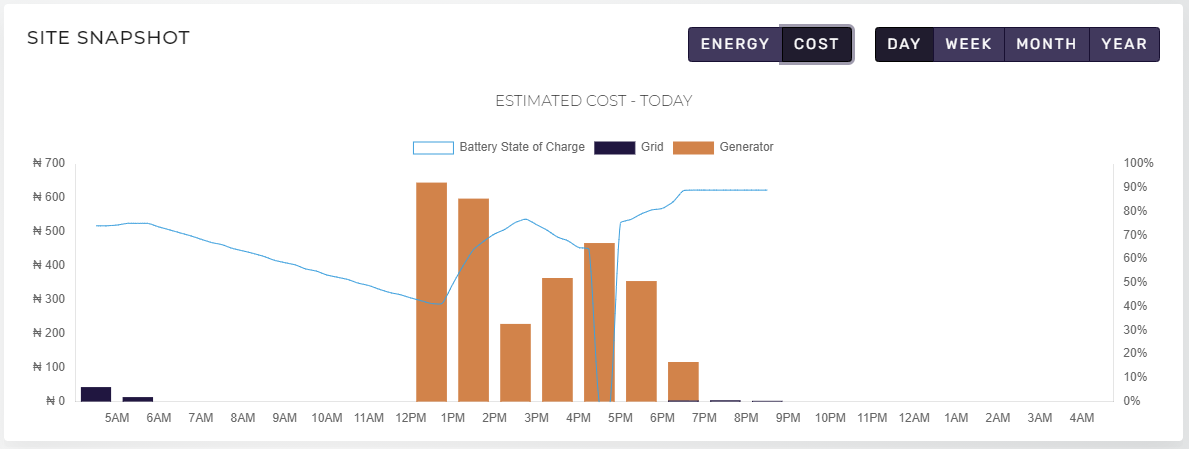
Here is the example screenshot related to the estimated cost snapshot of a day. Here you can see the hourly estimated cost of the power in your preferred currency.
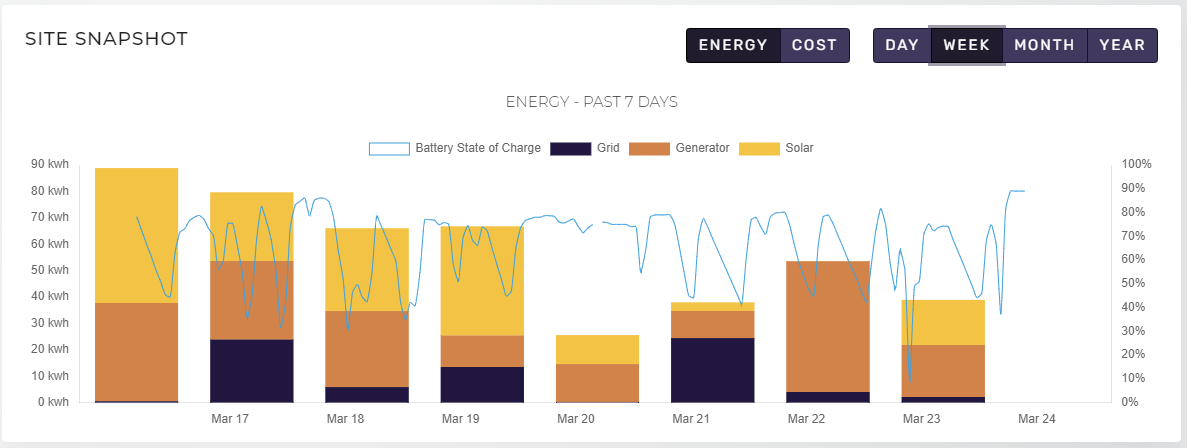
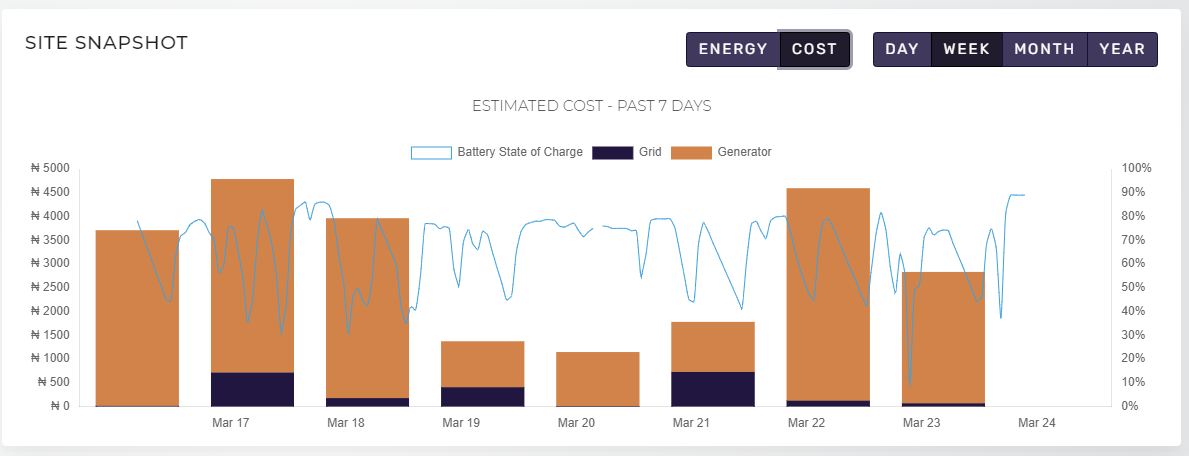
You can see these reports on a weekly, monthly and yearly basis as well. Please check the Energy and Cost snapshots for a week below:
(1.3) Fuel Level

This section displays the diesel level of the generator as per the last sync time. It also shows the total capacity as well as the fuel level in percentage of the total capacity.
(1.3) Battery state of charge

This section displays the battery state of charge in percentage.
(1.3) Grid Voltage

This section displays the Grid voltage in Volts.
(1.3) Active Alarms

This section displays the number of current active alarms respective to the site. You can go to the active alarm list by clicking on the provided button named “View Details”. Clicking this button redirects the user to the Alerts tab in the site dashboard.
(1.3) Daily comparison - Energy
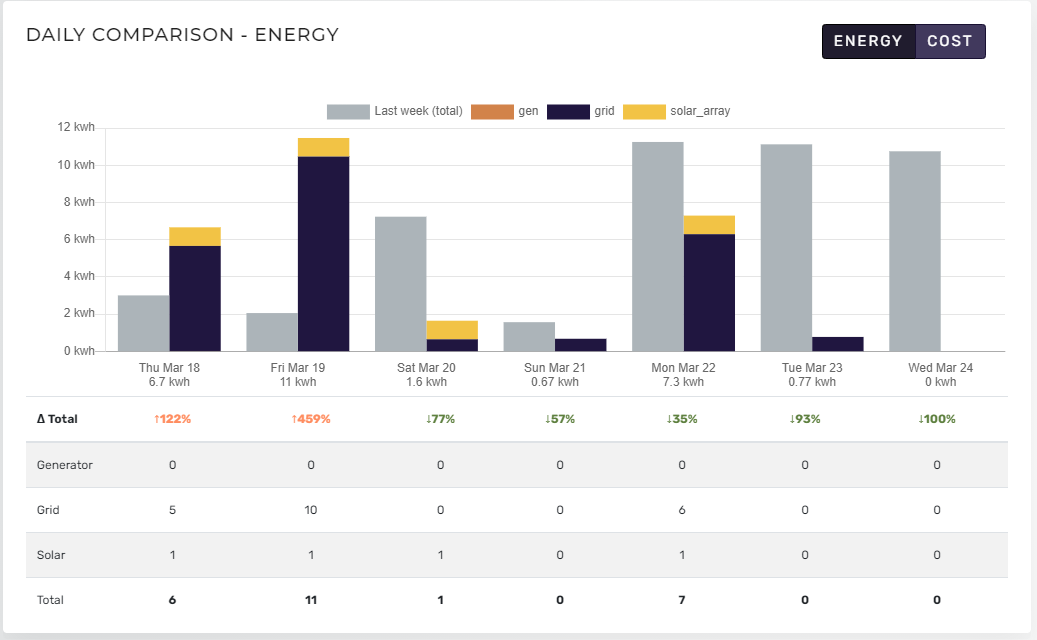
This section displays the daily comparison of energy consumed and daily comparison of estimated cost in a bar graph report. You can switch between Energy and Cost comparison reports by clicking on the provided buttons on the top.
For the Energy comparison the report shows the daily energy consumed in KWH from different sources like generator, grid and solar and it also the comparison with total energy consumed in the respective day of last week.
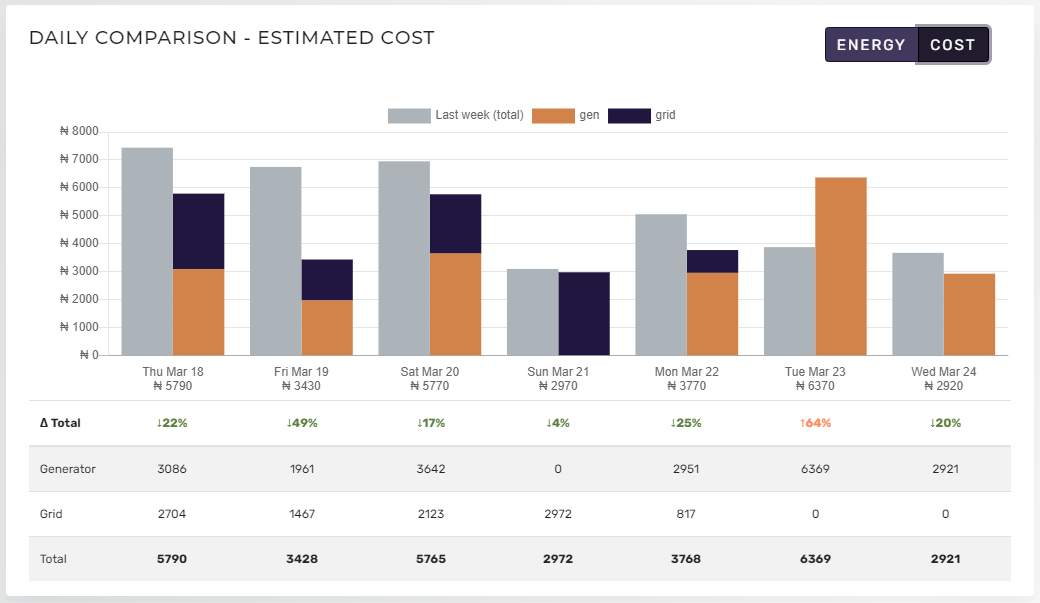
For the Estimated cost comparison the report shows the estimated daily cost as per generator and grid and it also shows the comparison with total estimated cost of the respective day of last week.
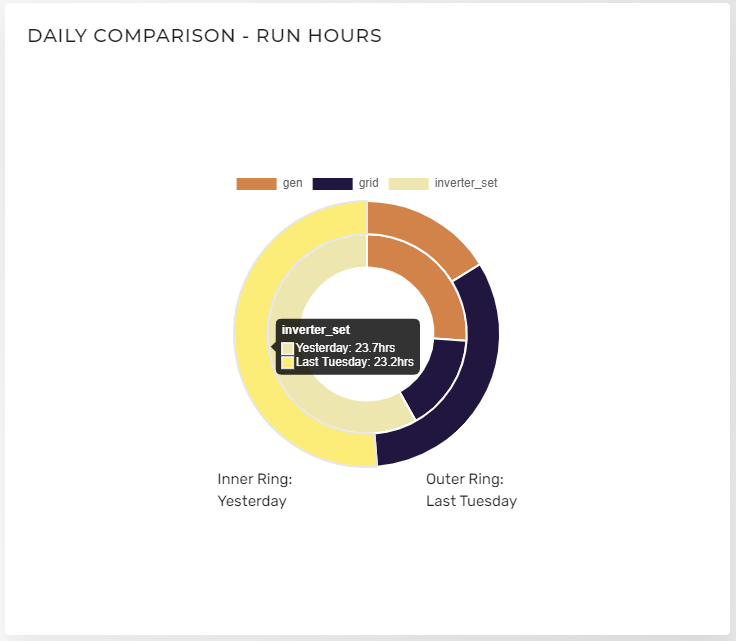
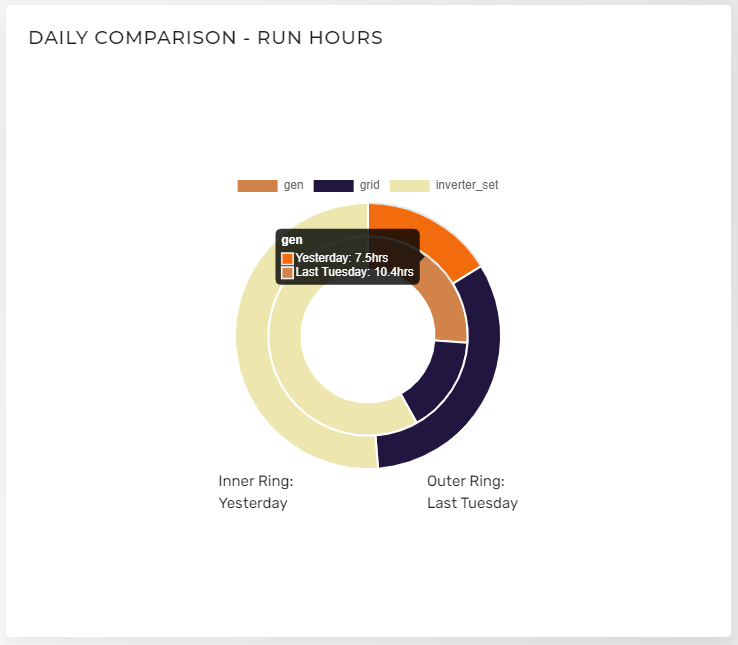
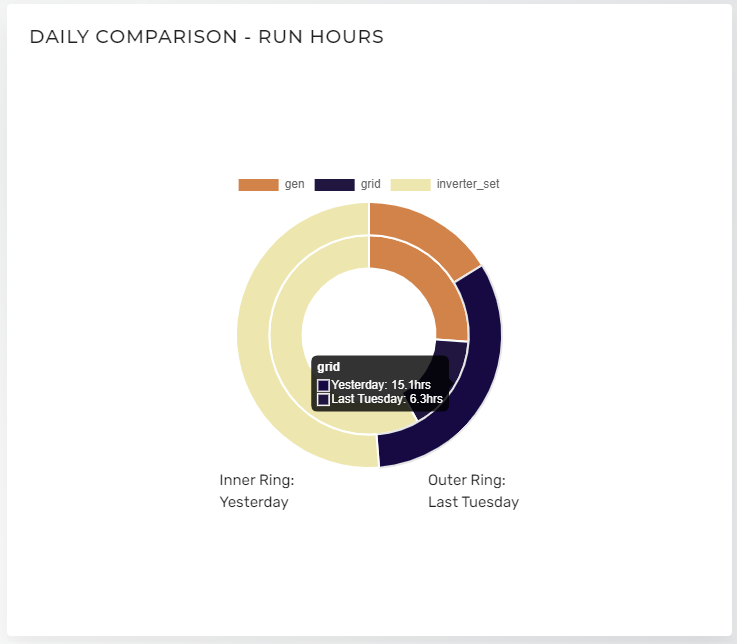
(1.3) Daily comparison - Run Hours
This section displays the graphical report of run hours of generator, grid and inverter set for yesterday and respective day of last week. This report displays the reports in the form of two rings inner and outer. The inner ring displays the run hours representation for yesterday and the outer ring displays the run hours representation for the respective week day of last week. The report shows the data in hours when a user hover by mouse on the ring sections for generator, grid and inverter set. Please check the below report screenshots.
(2) Monitor
The second tab on the Site dashboard is Monitor. Here you can see energy consumption history for Solar, Generator and Grid on a daily, weekly, monthly and yearly basis. It also shows the Fuel tank level history of the generator on a daily, weekly, monthly and yearly basis. You can switch between various reports for Solar, Generator, Grid and Fuel tank available on this tab by using the navigation bar available on the left side.
(2.1) Solar Array
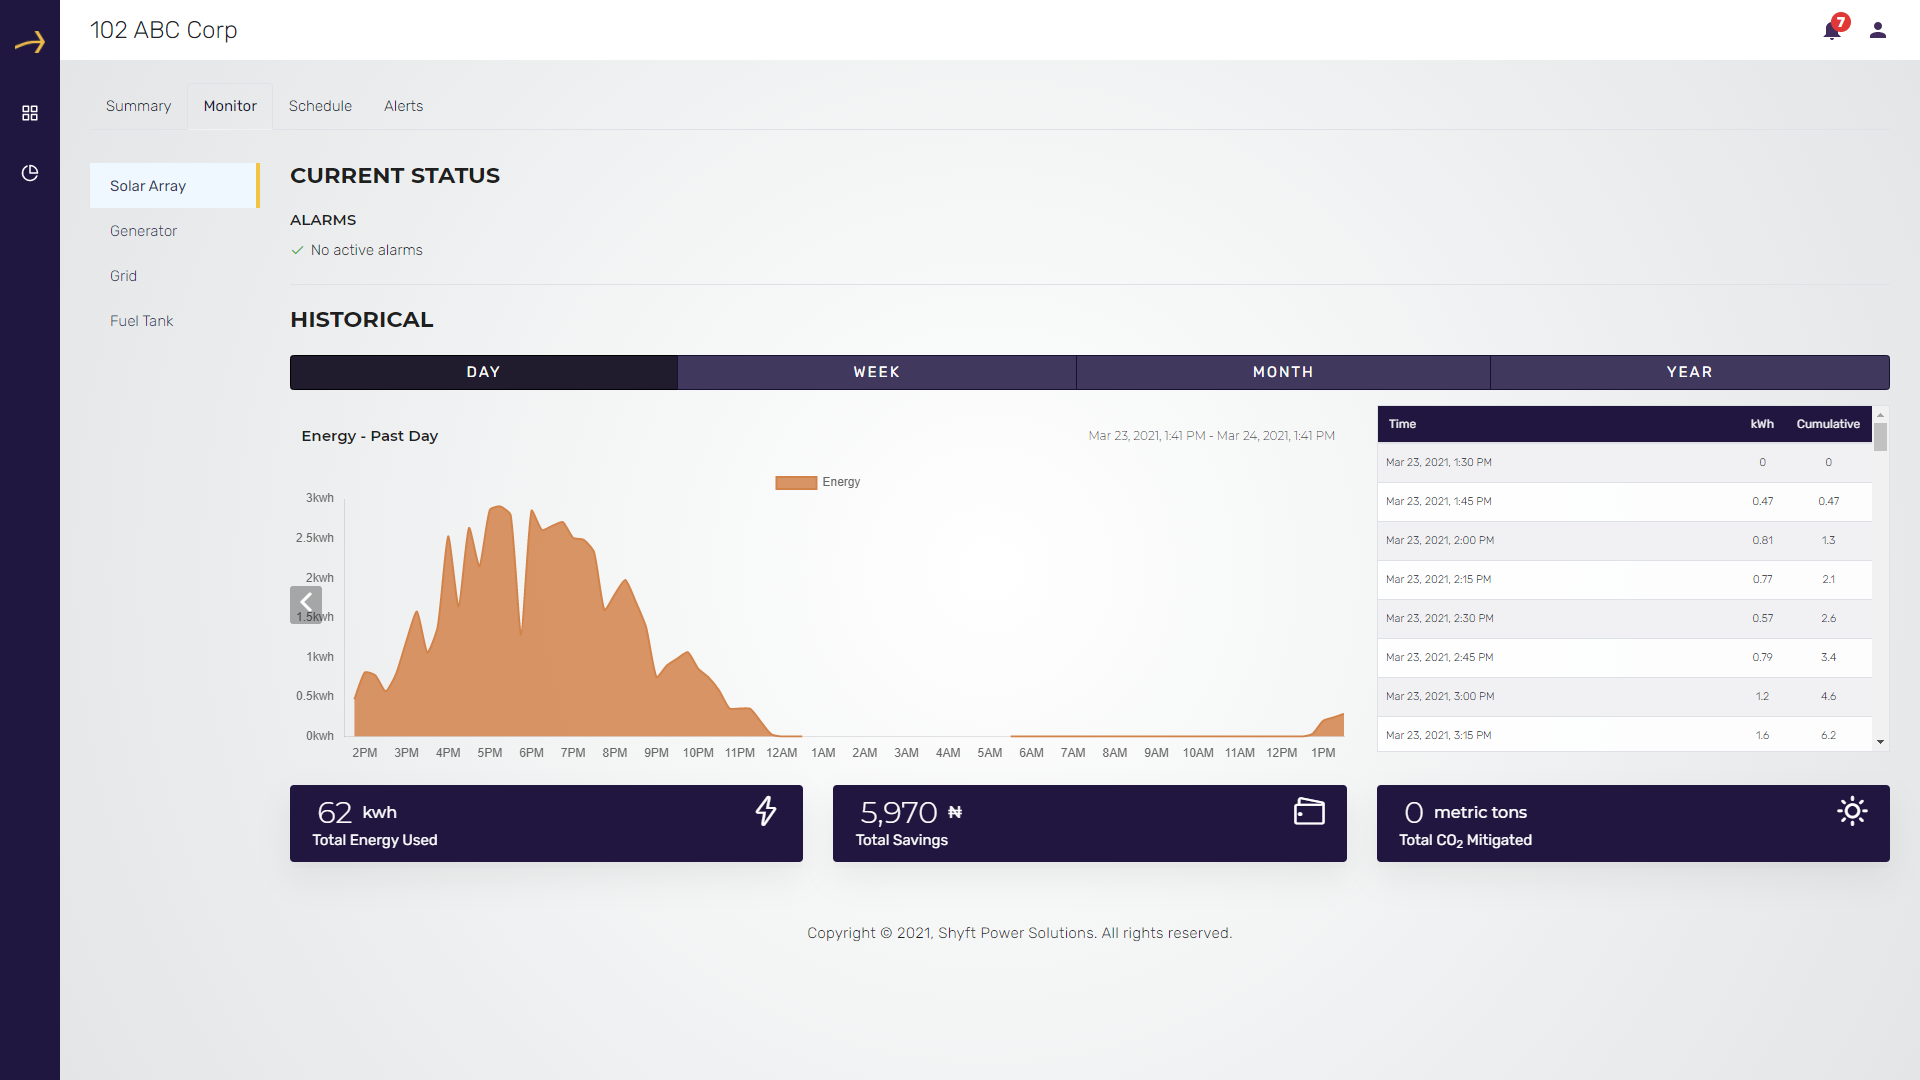
The first report on this tab is for Solar Array. This report displays the Solar power consumption in KWH on a daily, weekly, monthly and yearly basis. Please check the below screenshot that displays the solar energy consumption in KWH for a day on an hourly basis. You can switch between daily, weekly, monthly and yearly history using the provided buttons on the top.
Below is the screenshot that displays the solar energy consumption in KWH for a week on a daily basis.
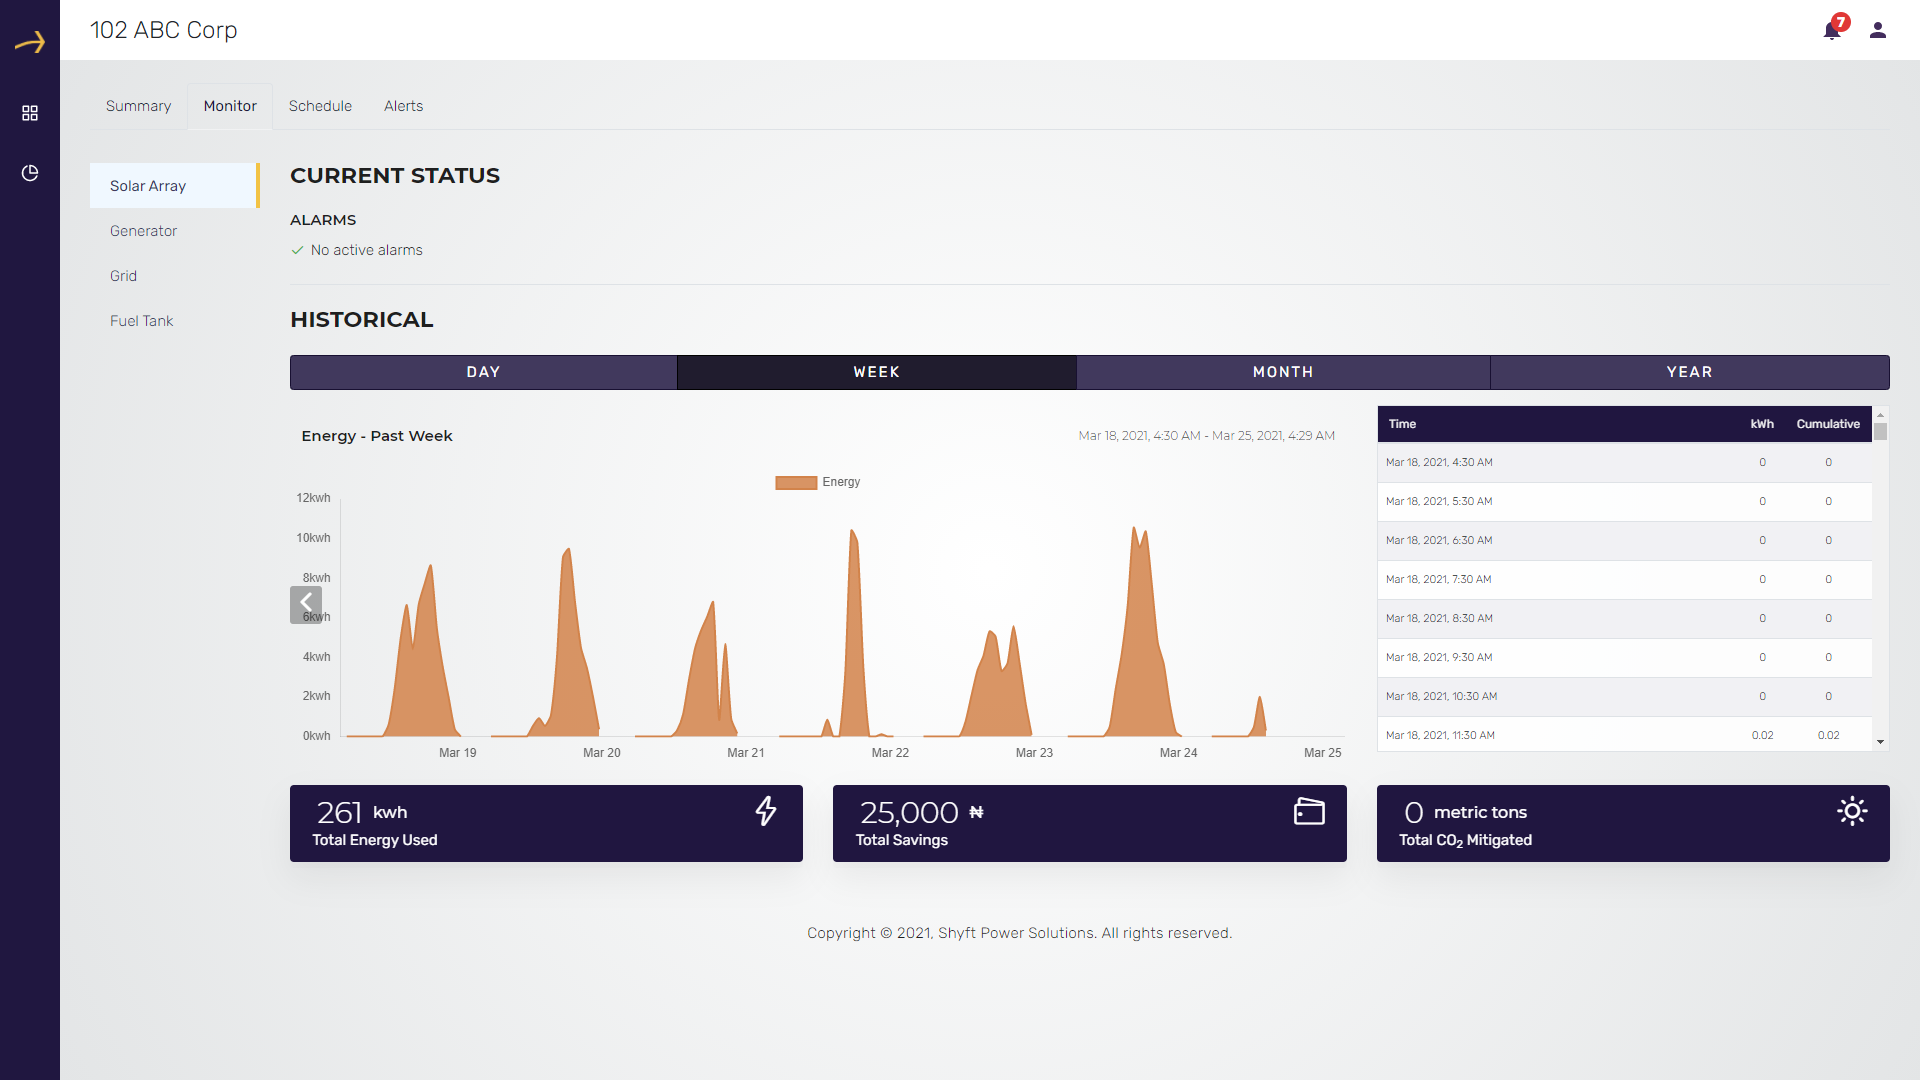
This report also shows Total energy used, Total savings made by using solar energy in the user’s currency and mitigated CO2 (carbon di-oxide) level in metric tons by using solar energy
(2.2) Generator
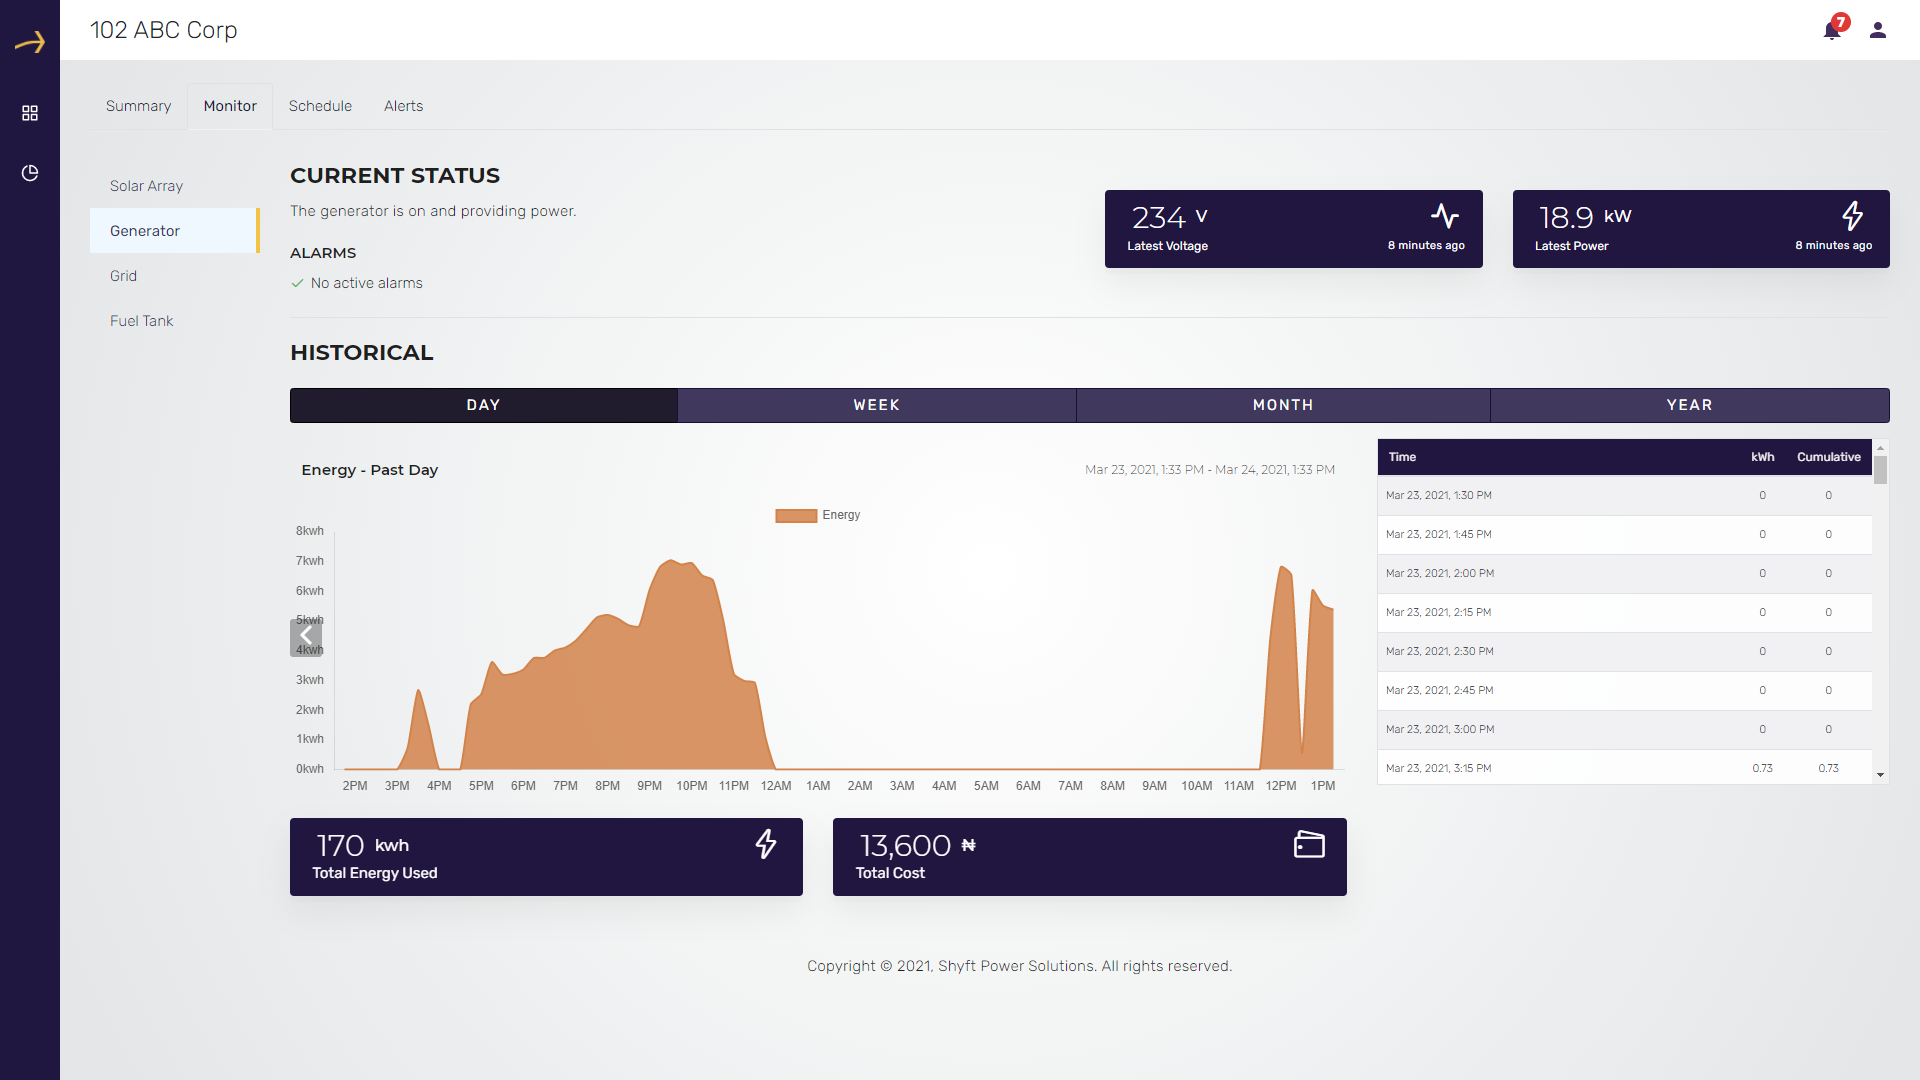
This is the second report in the Monitor tab on the site dashboard. To go to this report click on the Generator menu item from the left side navigation bar as highlighted in the above screenshot.
This report displays the Generator power consumption in KWH on a daily, weekly, monthly and yearly basis. Please check the above screenshot that displays the Generator energy consumption in KWH for a day on an hourly basis. You can switch between daily, weekly, monthly and yearly history using the provided buttons on the top.
This report also displays the latest voltage in Volts and Latest power in KW. In addition to that this report also displays the Total energy used and Total estimated cost in user’s currency. Please check the above screenshot for reference.
(2.3) Grid
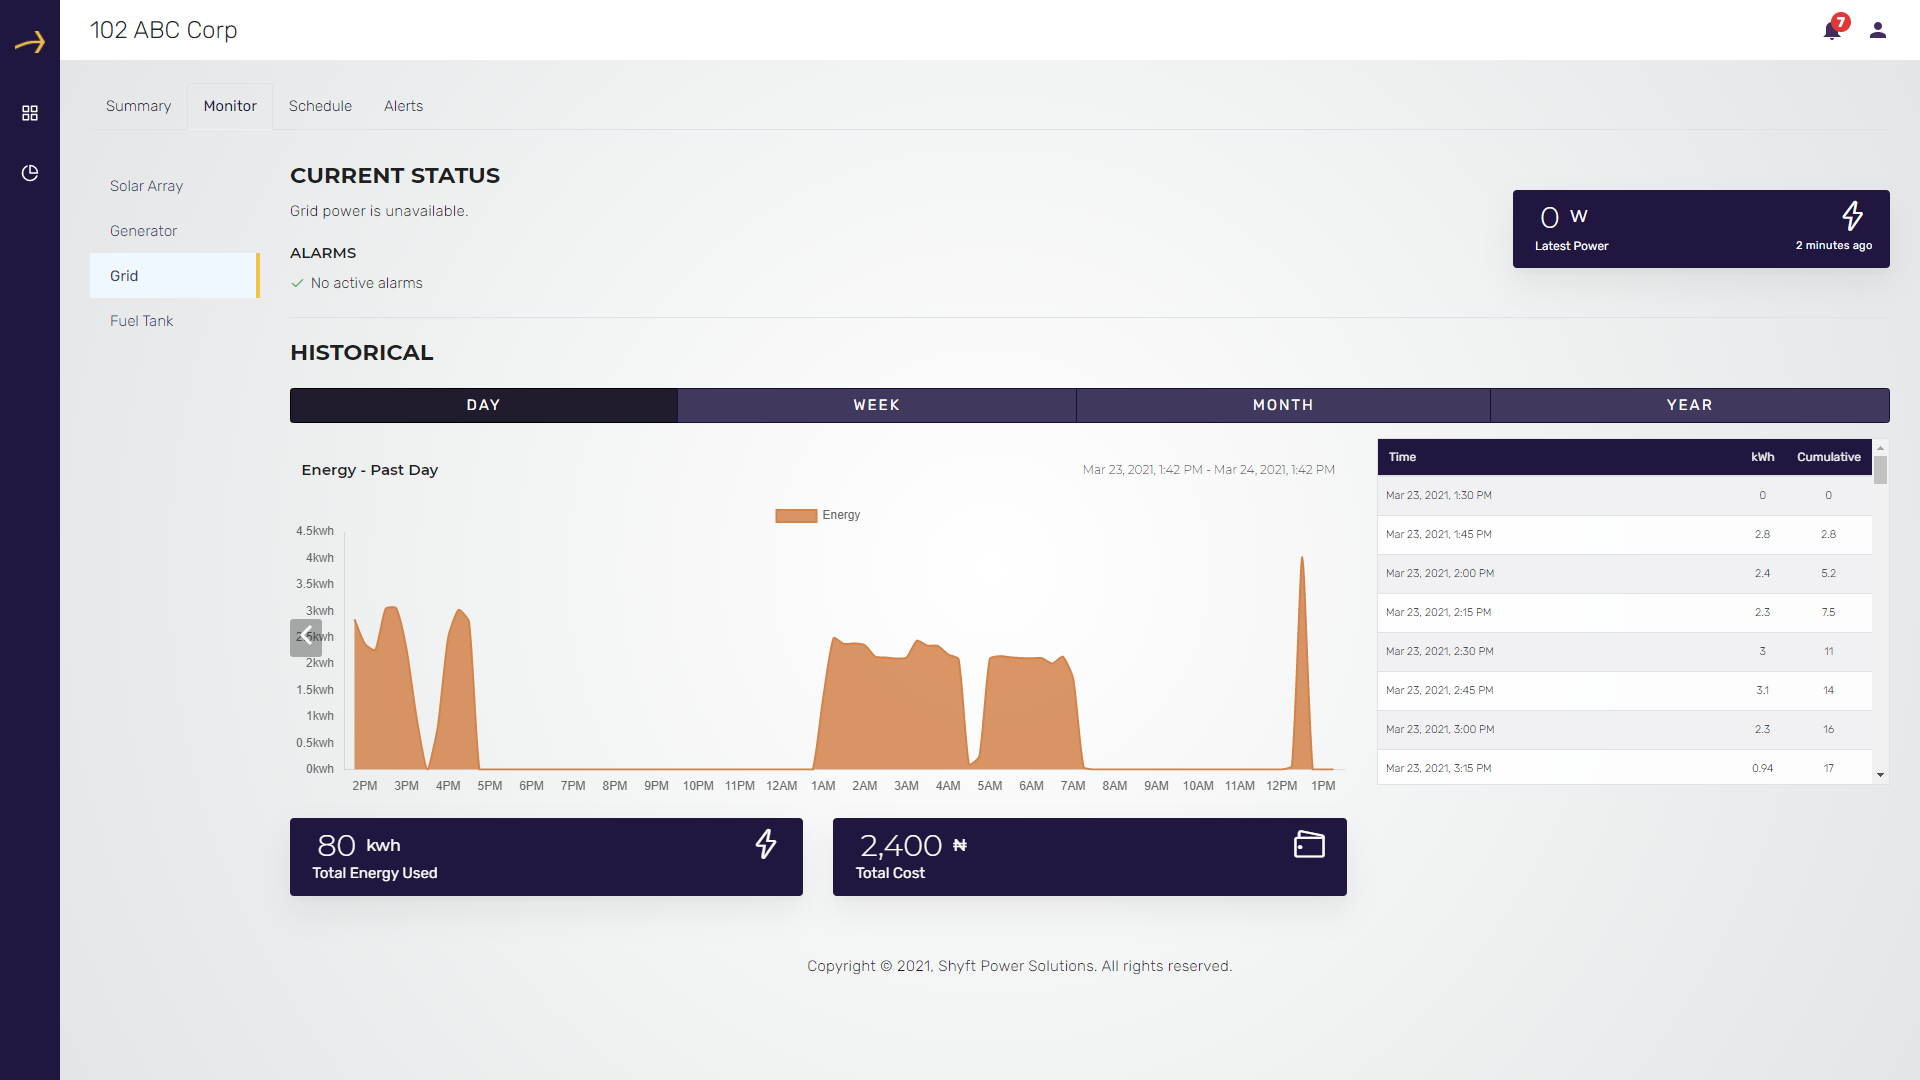
This is the third report in the Monitor tab on the site dashboard. To go to this report click on the Grid menu item from the left side navigation bar as highlighted in the above screenshot.
This report displays the Grid power consumption in KWH on a daily, weekly, monthly and yearly basis. Please check the above screenshot that displays the Grid energy consumption in KWH for a day on an hourly basis. You can switch between daily, weekly, monthly and yearly history using the provided buttons on the top.
This report also displays the latest power in Watts, total energy used and total estimated cost based on the run hours of the grid.
(2.4) Fuel Tank
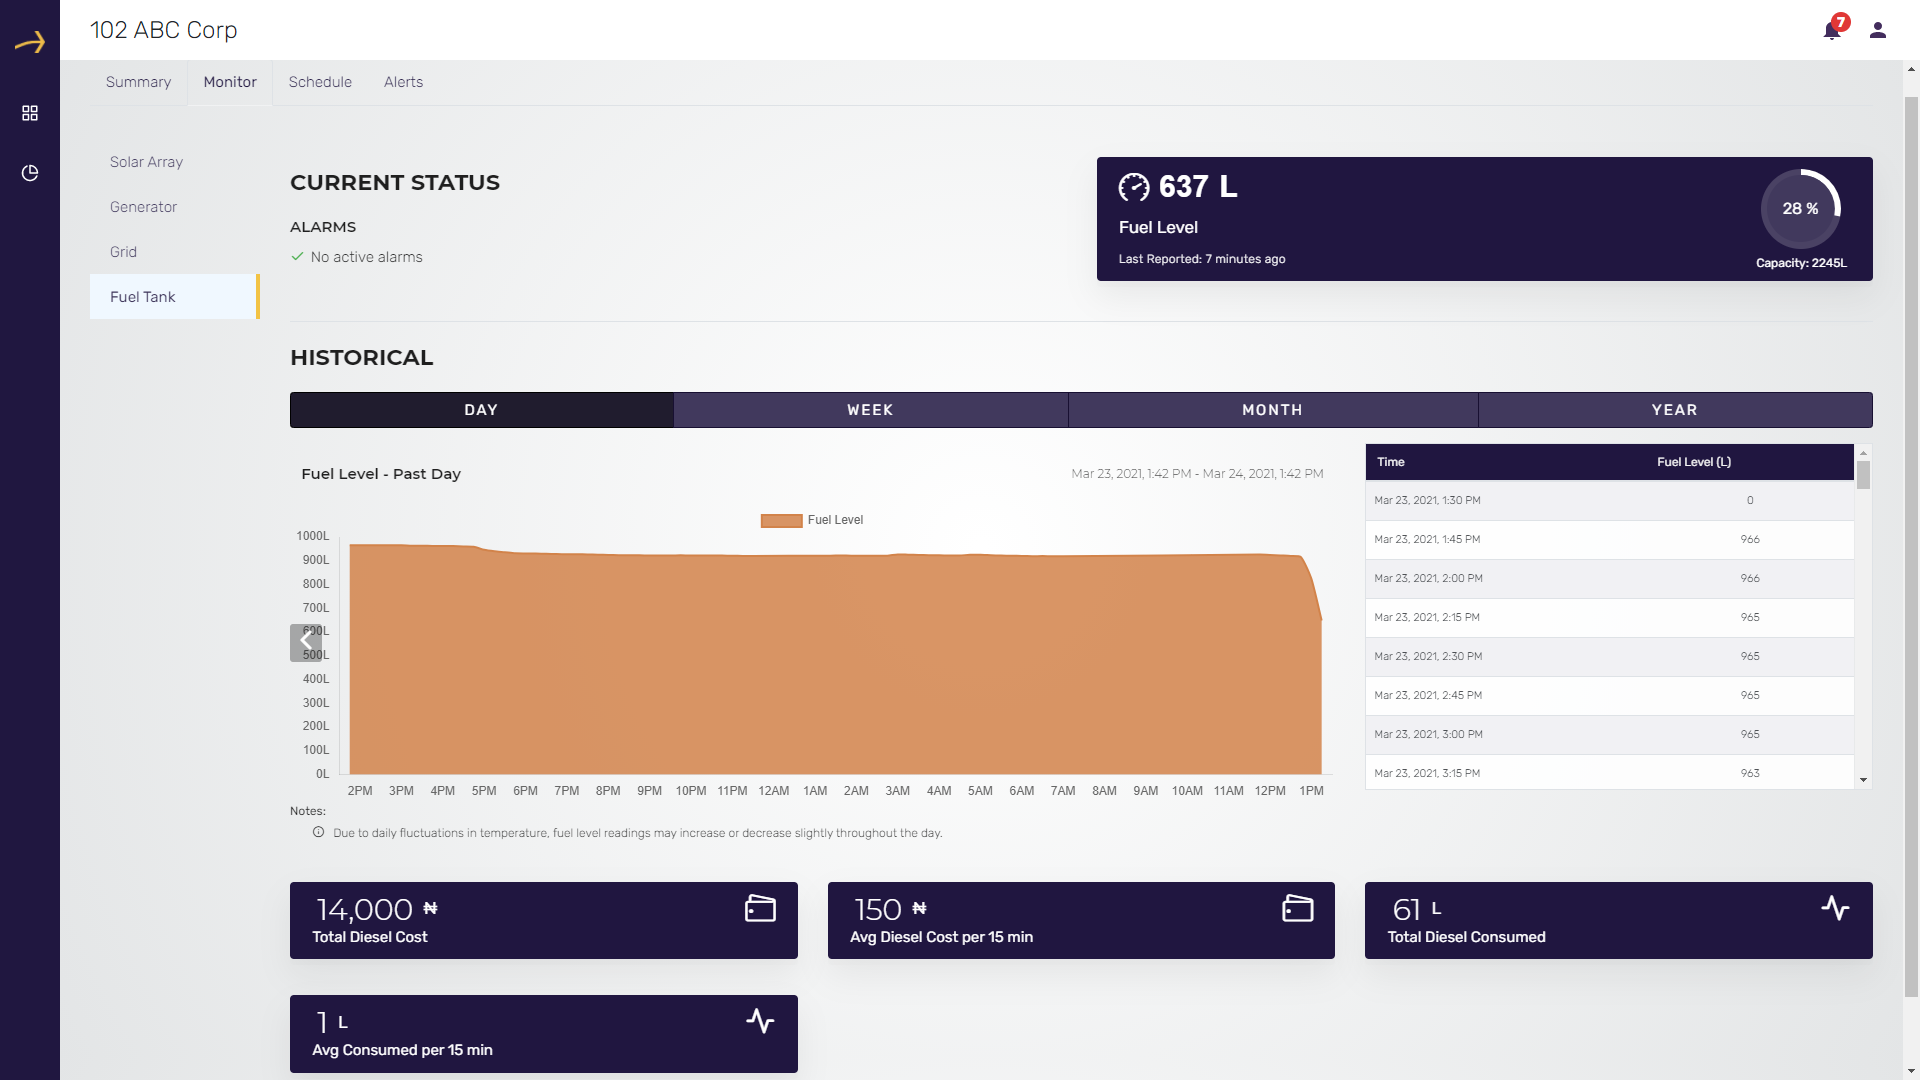
This is the fourth report in the Monitor tab on the site dashboard. To go to this report click on the Fuel tank menu item from the left side navigation bar as highlighted in the above screenshot.
This report displays the Fuel tank diesel level in Liters on a daily, weekly, monthly and yearly basis. Please check the above screenshot that displays the Fuel level in liters for a day on an hourly basis. You can switch between daily, weekly, monthly and yearly history using the provided buttons on the top.
This report also displays the current fuel level in liters as well as in percentage of the total fuel tank capacity. It also shows total estimated diesel cost, average diesel cost per 15 minutes, total diesel consumed in the respective day, average diesel consumed per 15 minutes.
Control
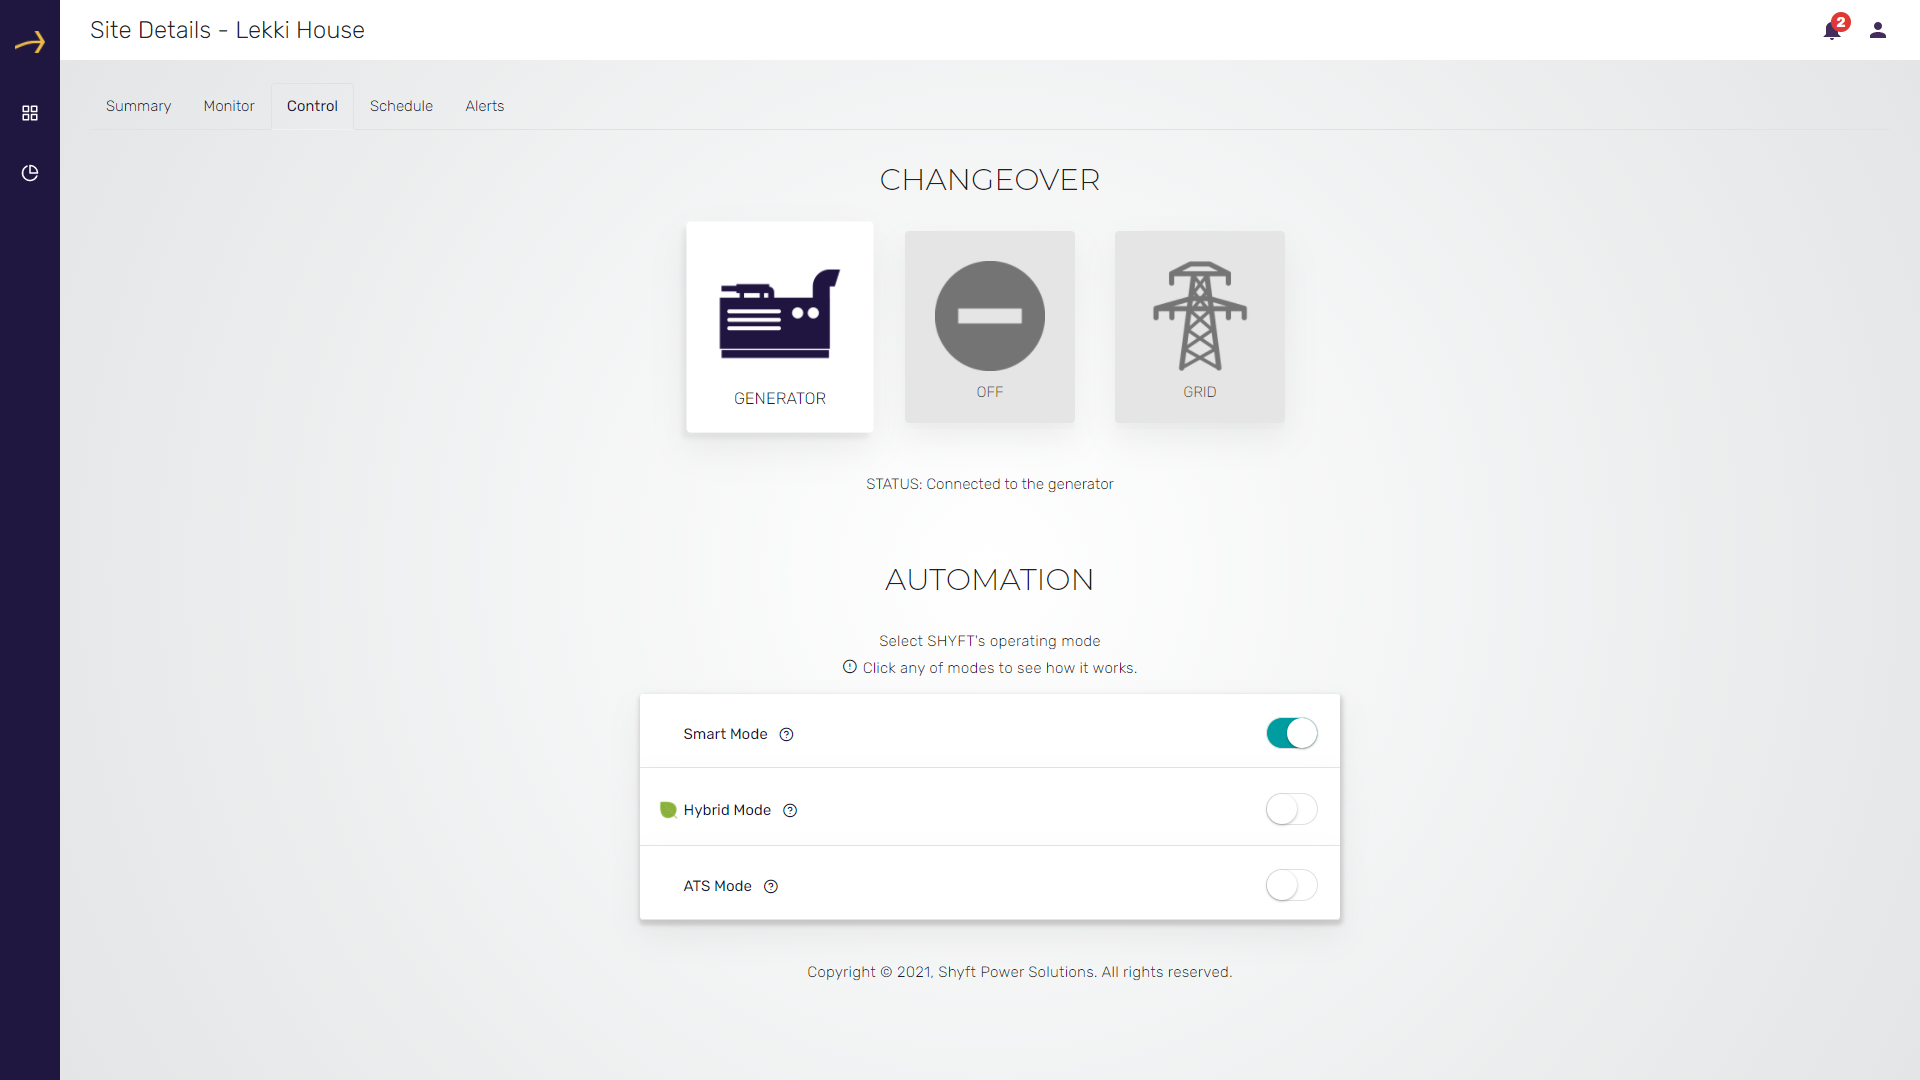
This is the third tab in the Site dashboard (available for admin users only).
From here you can switch the power source of the respective site to Generator, Grid or Turn the power off. Also you can select different SHYFT operating modes from here Like Smart Mode, Hybrid Mode and ATS Mode. Please check the related screenshot above:
CHANGEOVER
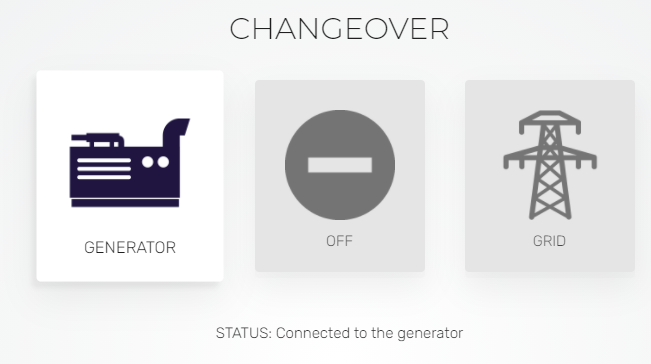
On the SHYFT power application you get the changeover switch in the site dashboard under the Control tab. Please check the above screenshot:
From here you can switch between different power modes like Generator and Grid and also turn off the power of the respective site.
To switch to a different mode click on the respective icon. For example for switching the power to Grid, click on the grid icon. It will open a confirmation window. Click on the “Confirm” button to confirm the power mode change to Grid.
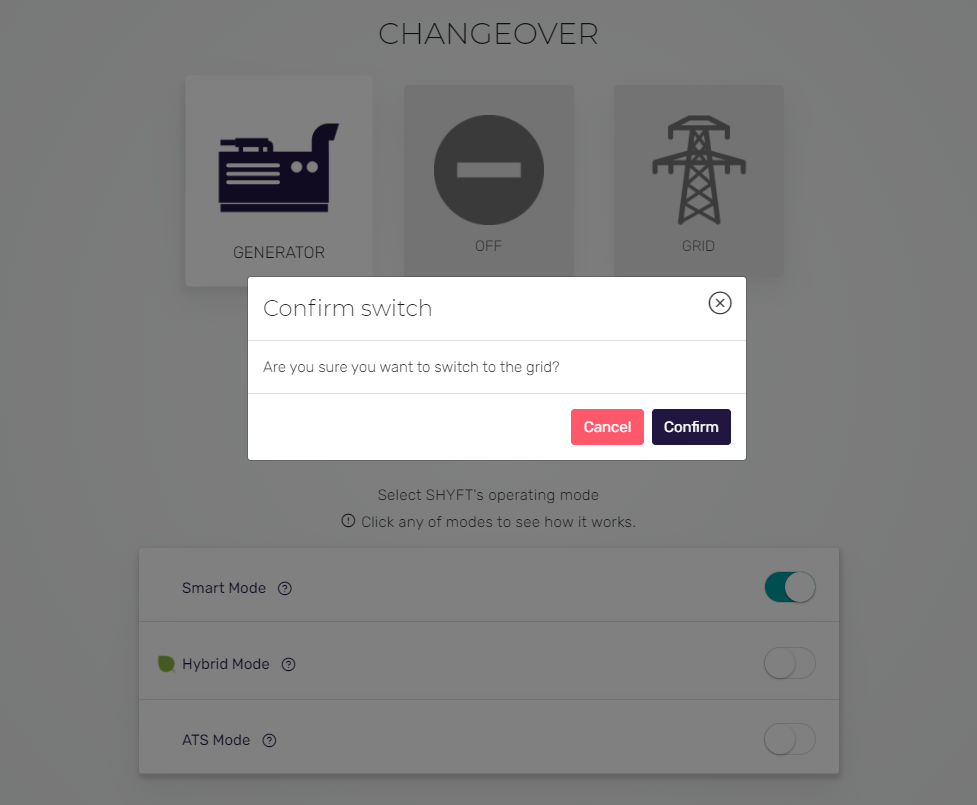
After confirmation, the power will be switched to the GRID and the status message will also be displayed as shown in the below screenshot.
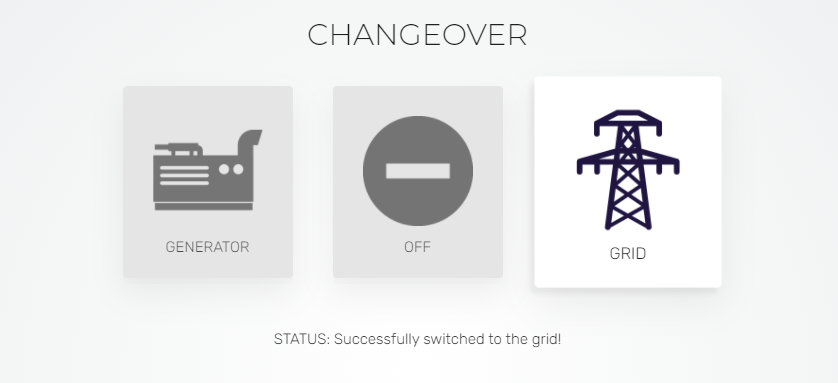
To change back to generator, you need to click on the GENERATOR icon and confirm the change.
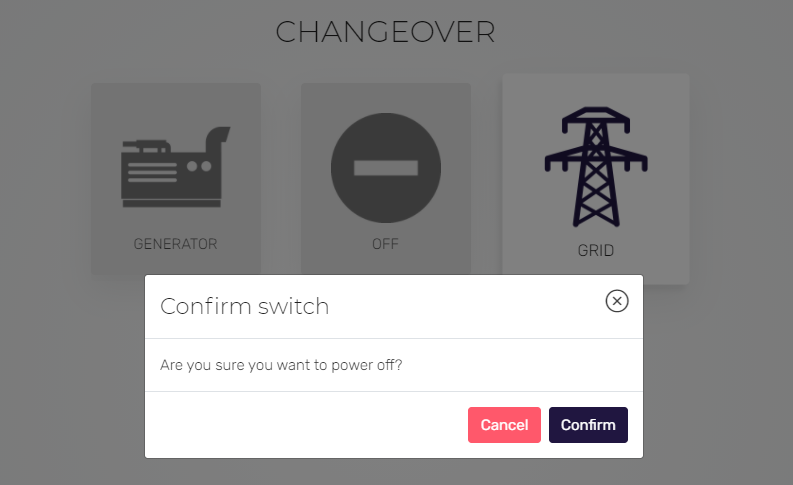
To switch off the power you need to click on the OFF icon. It will open a pop-up window to confirm the change to turn off the power. Click on the Confirm button to make the change.
AUTOMATION:
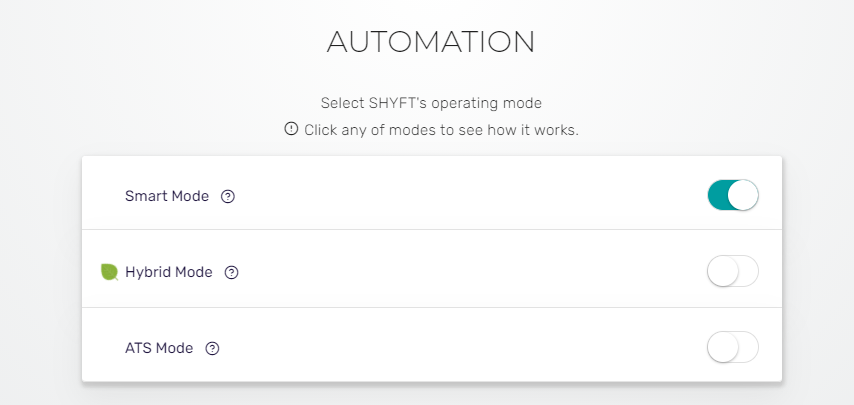
Using this section of the SHYFT power app in the site dashboard under the control tab you can switch between various SHYFT operating modes like Smart Mode, Hybrid Mode, ATS Mode. For switching between these modes you need to click on the provided toggle buttons respective to each of the modes. Please check the related screenshot above:
Here are the meanings of each SHYFT operating modes:
- Smart Mode
In this mode, SHYFT will notify you when the grid has lost power, giving you the option to turn on the generator remotely.
When grid power returns, SHYFT will automatically switch to the grid and turn off your generator.
- Hybrid Mode
In this mode, SHYFT will automatically turn to the OFF position and connect to the inverter when there is a loss in grid power.When your batteries fall to a low state of charge, SHYFT will automatically switch you to your generator.
- ATS Mode
In this mode, SHYFT will automatically start your generator whenever the grid is not available.
You will still be alerted to any changes, but no action is required from you to switch power sources, or to start or stop the generator.
- Maintenance mode
In this mode, Your SHYFT Smart Transfer Switch will be in maintenance mode.
While your SHYFT device is in maintenance mode, it can only be operated via the manual switches on the device.
Schedule
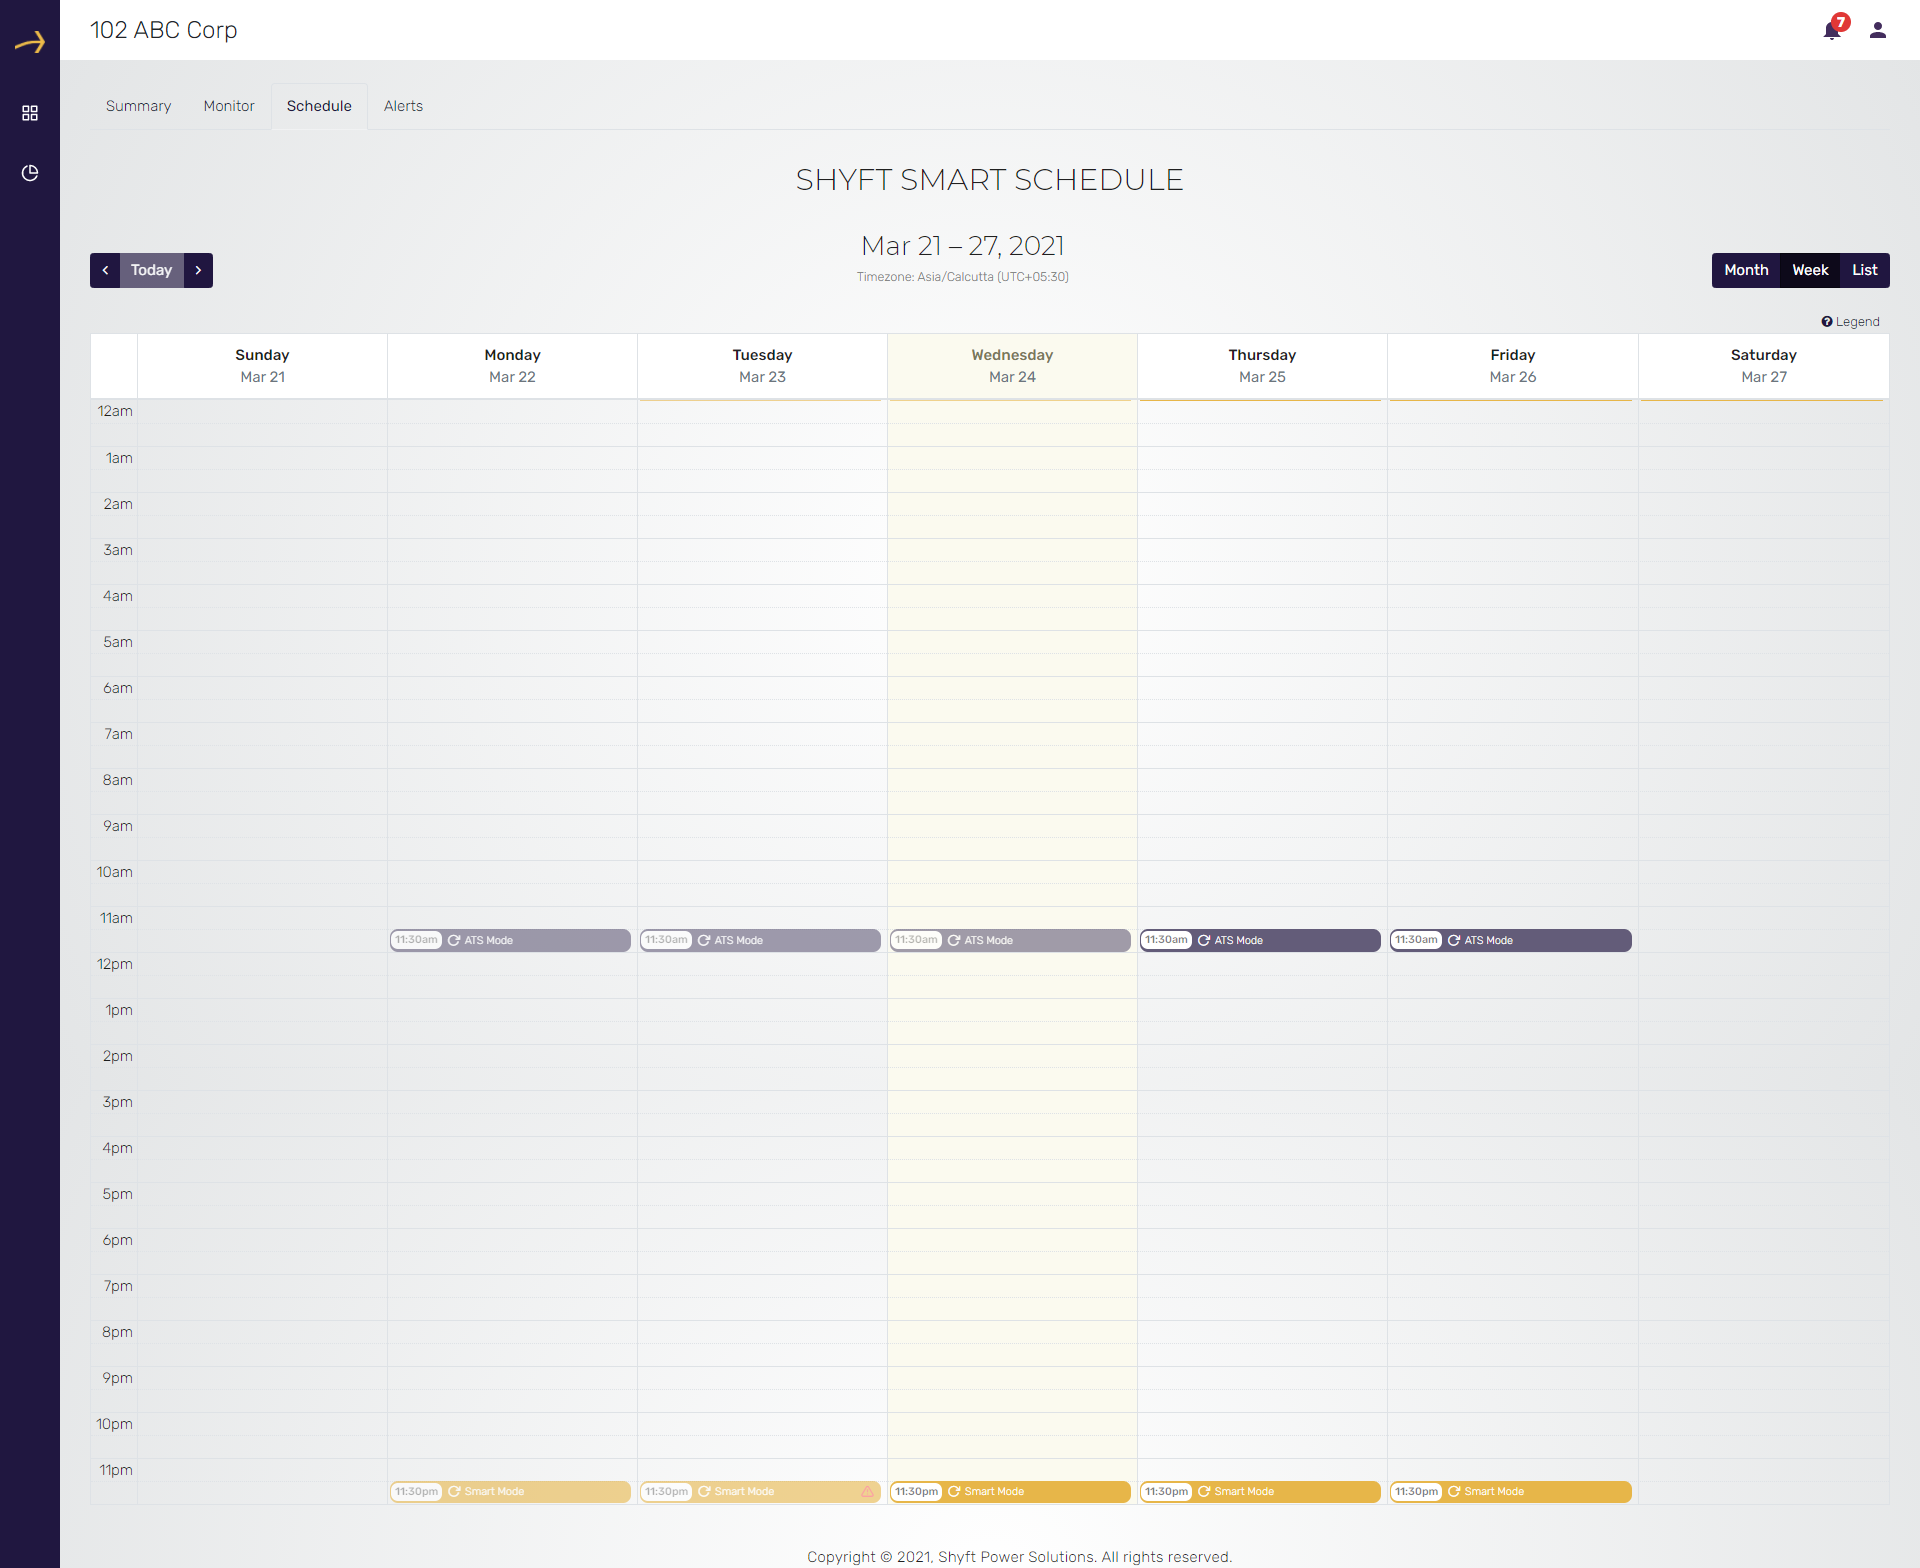
This is another tab in the Site dashboard as highlighted in the above screenshot. It shows the schedules added for the site on a calendar and also has the feature to create new schedules.
You can switch the calendar display between three different modes Month, Week and List. By default the calendar is loaded on the weekly mode (middle tab). This mode displays the added schedules on weekdays of the current week. Please check the related screenshot above.
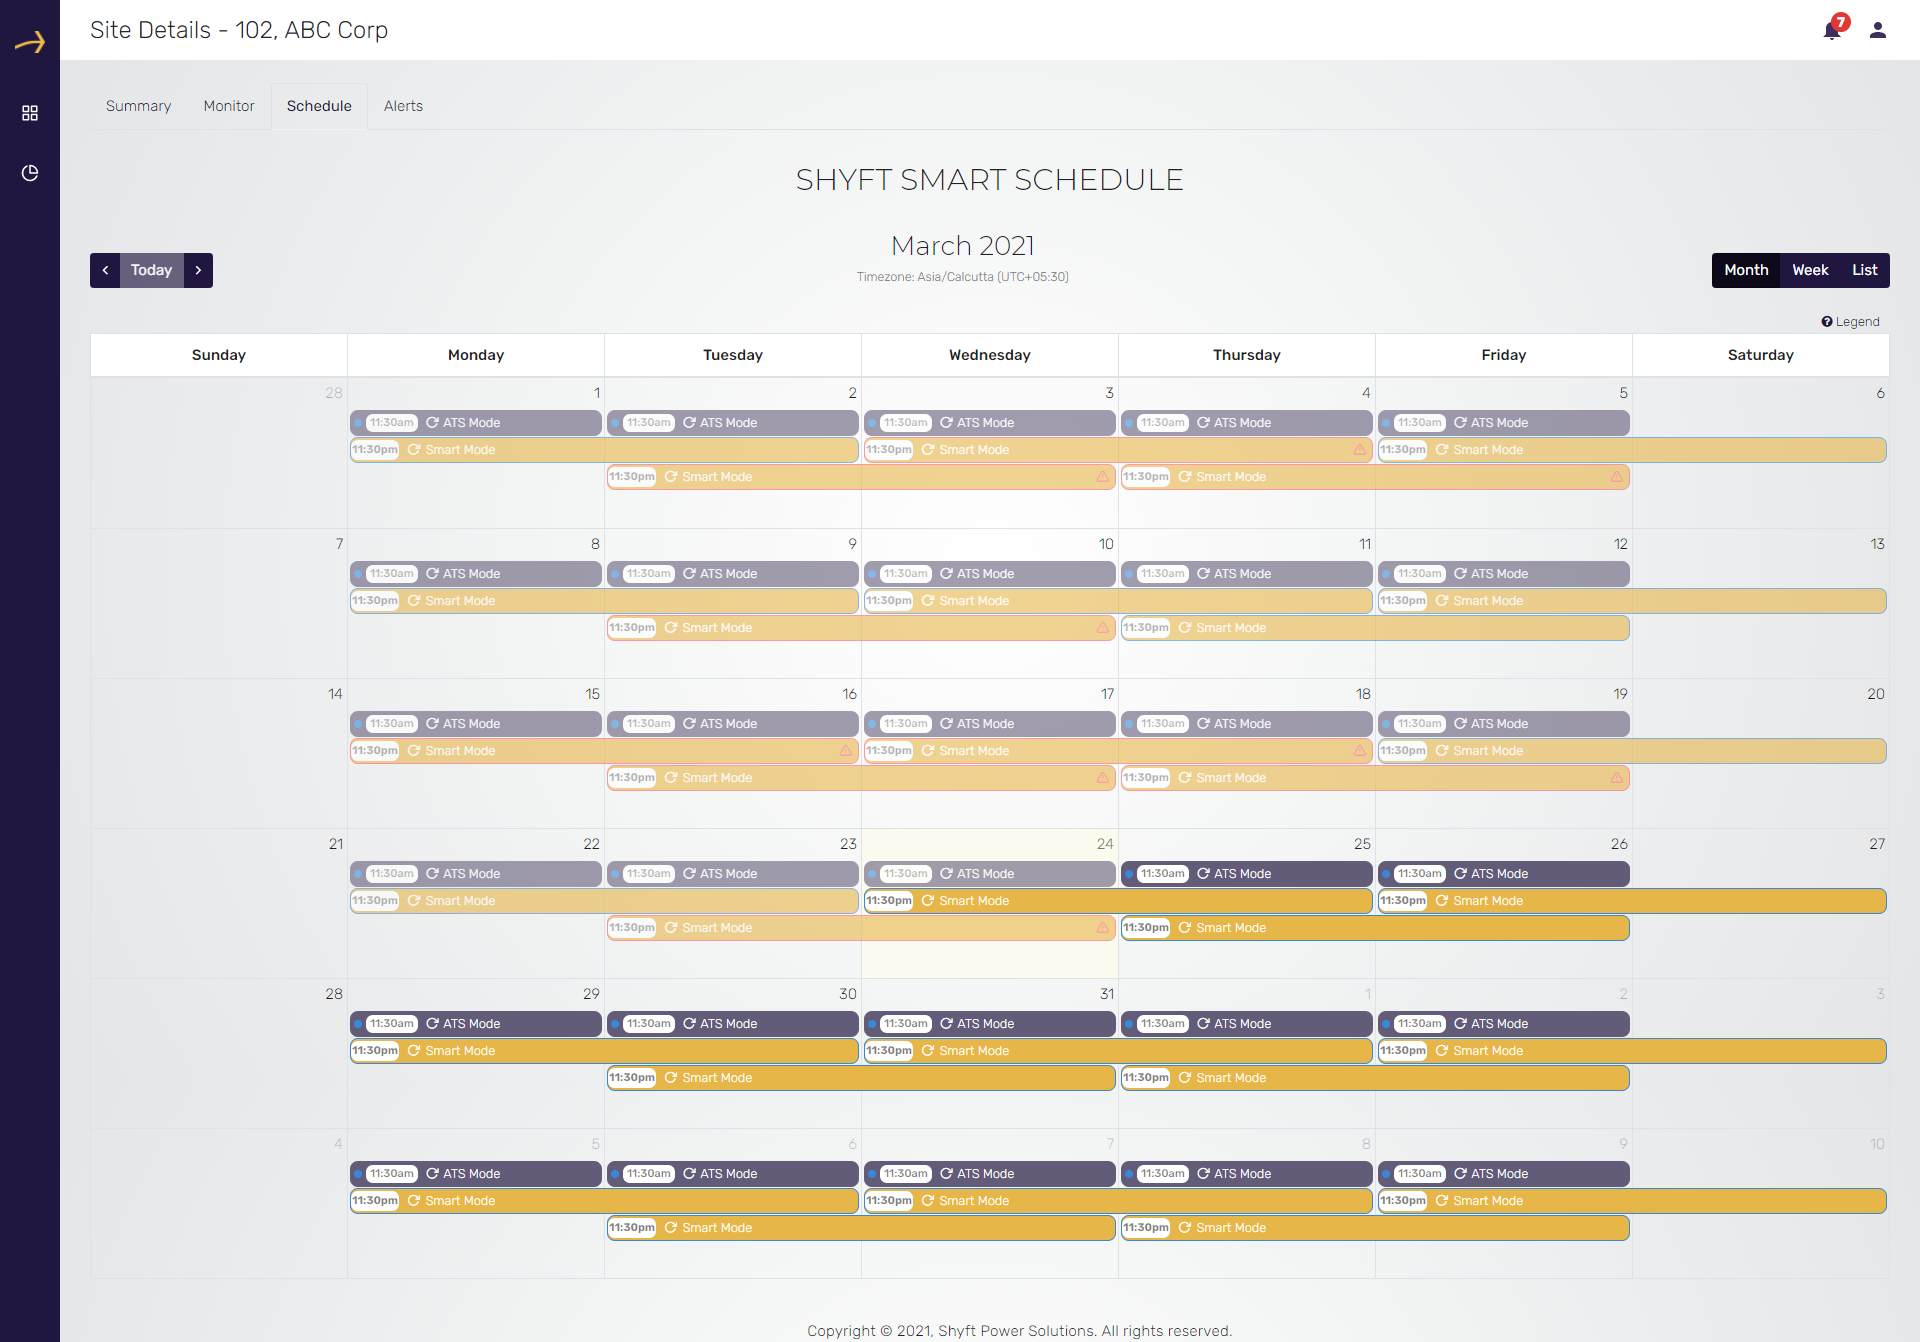
You can click on the Month tab (First tab) from the top to switch the calendar mode to Monthly mode. Here the added schedules are displayed for all dates of the current month. Please check the related screenshot above.
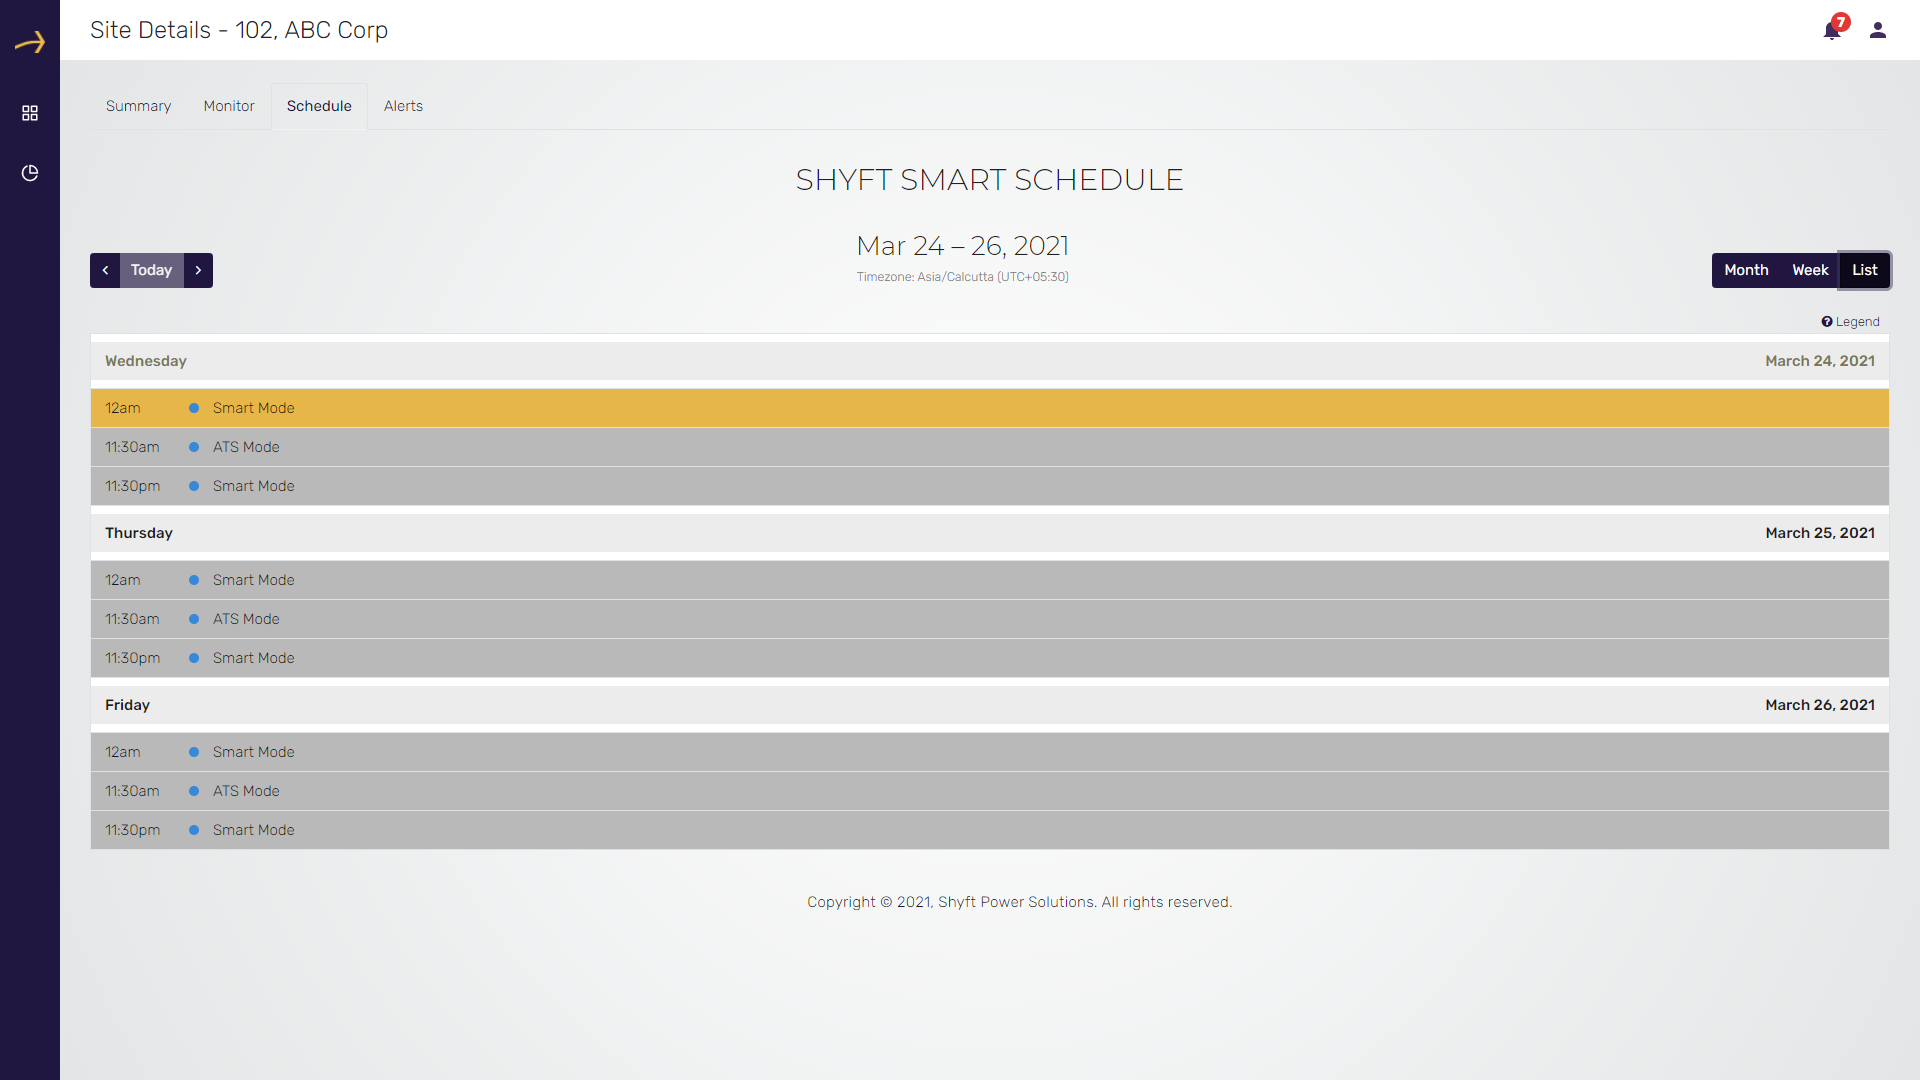
To switch to the list mode you need to click on the List tab (Third tab) from the top. Here the added schedules are displayed for the week days of the current week in a list. Please check the related screenshot above.

You can see the added schedule details by clicking on the schedule shown on the calendar. Please check the above screenshot for the scheduled action which has been ended:
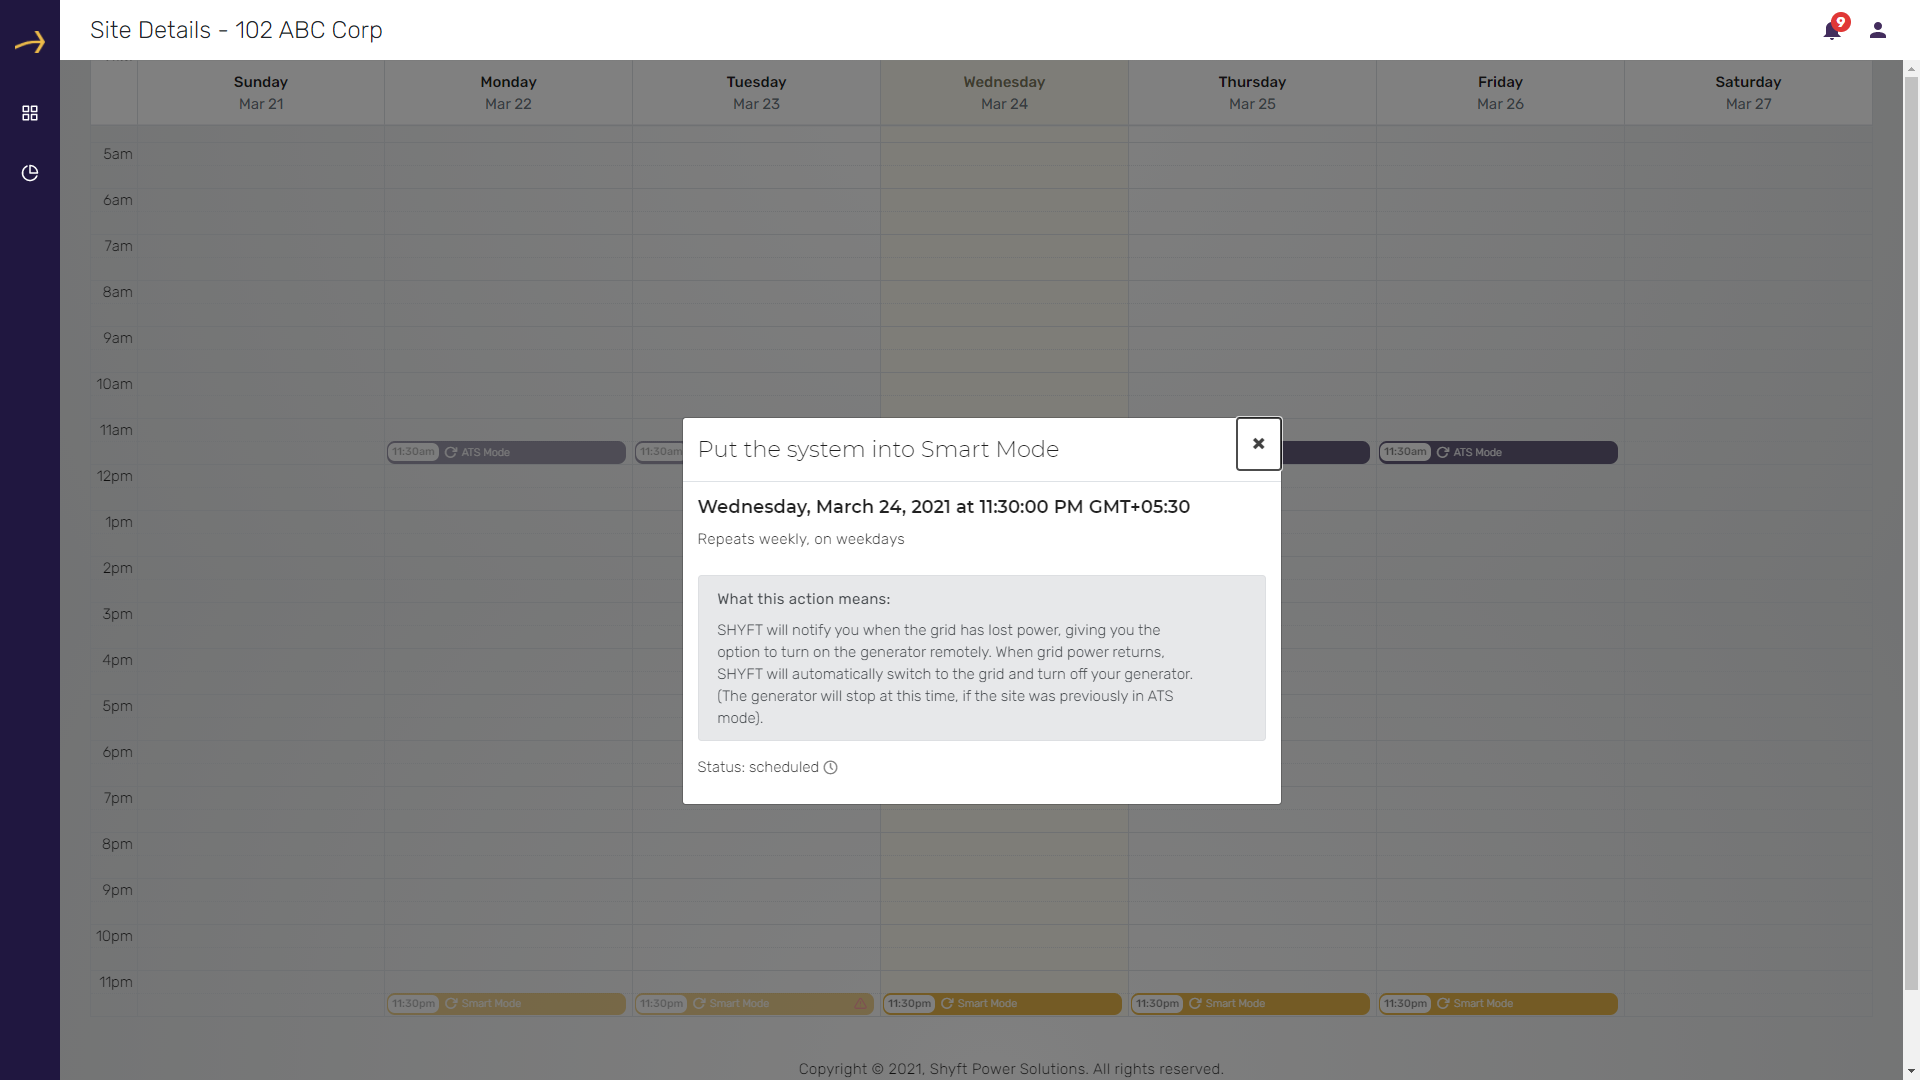
Above is the screenshot for the scheduled action which is not completed yet:
For adding a schedule to the respective site please check this article.
(5) Alerts
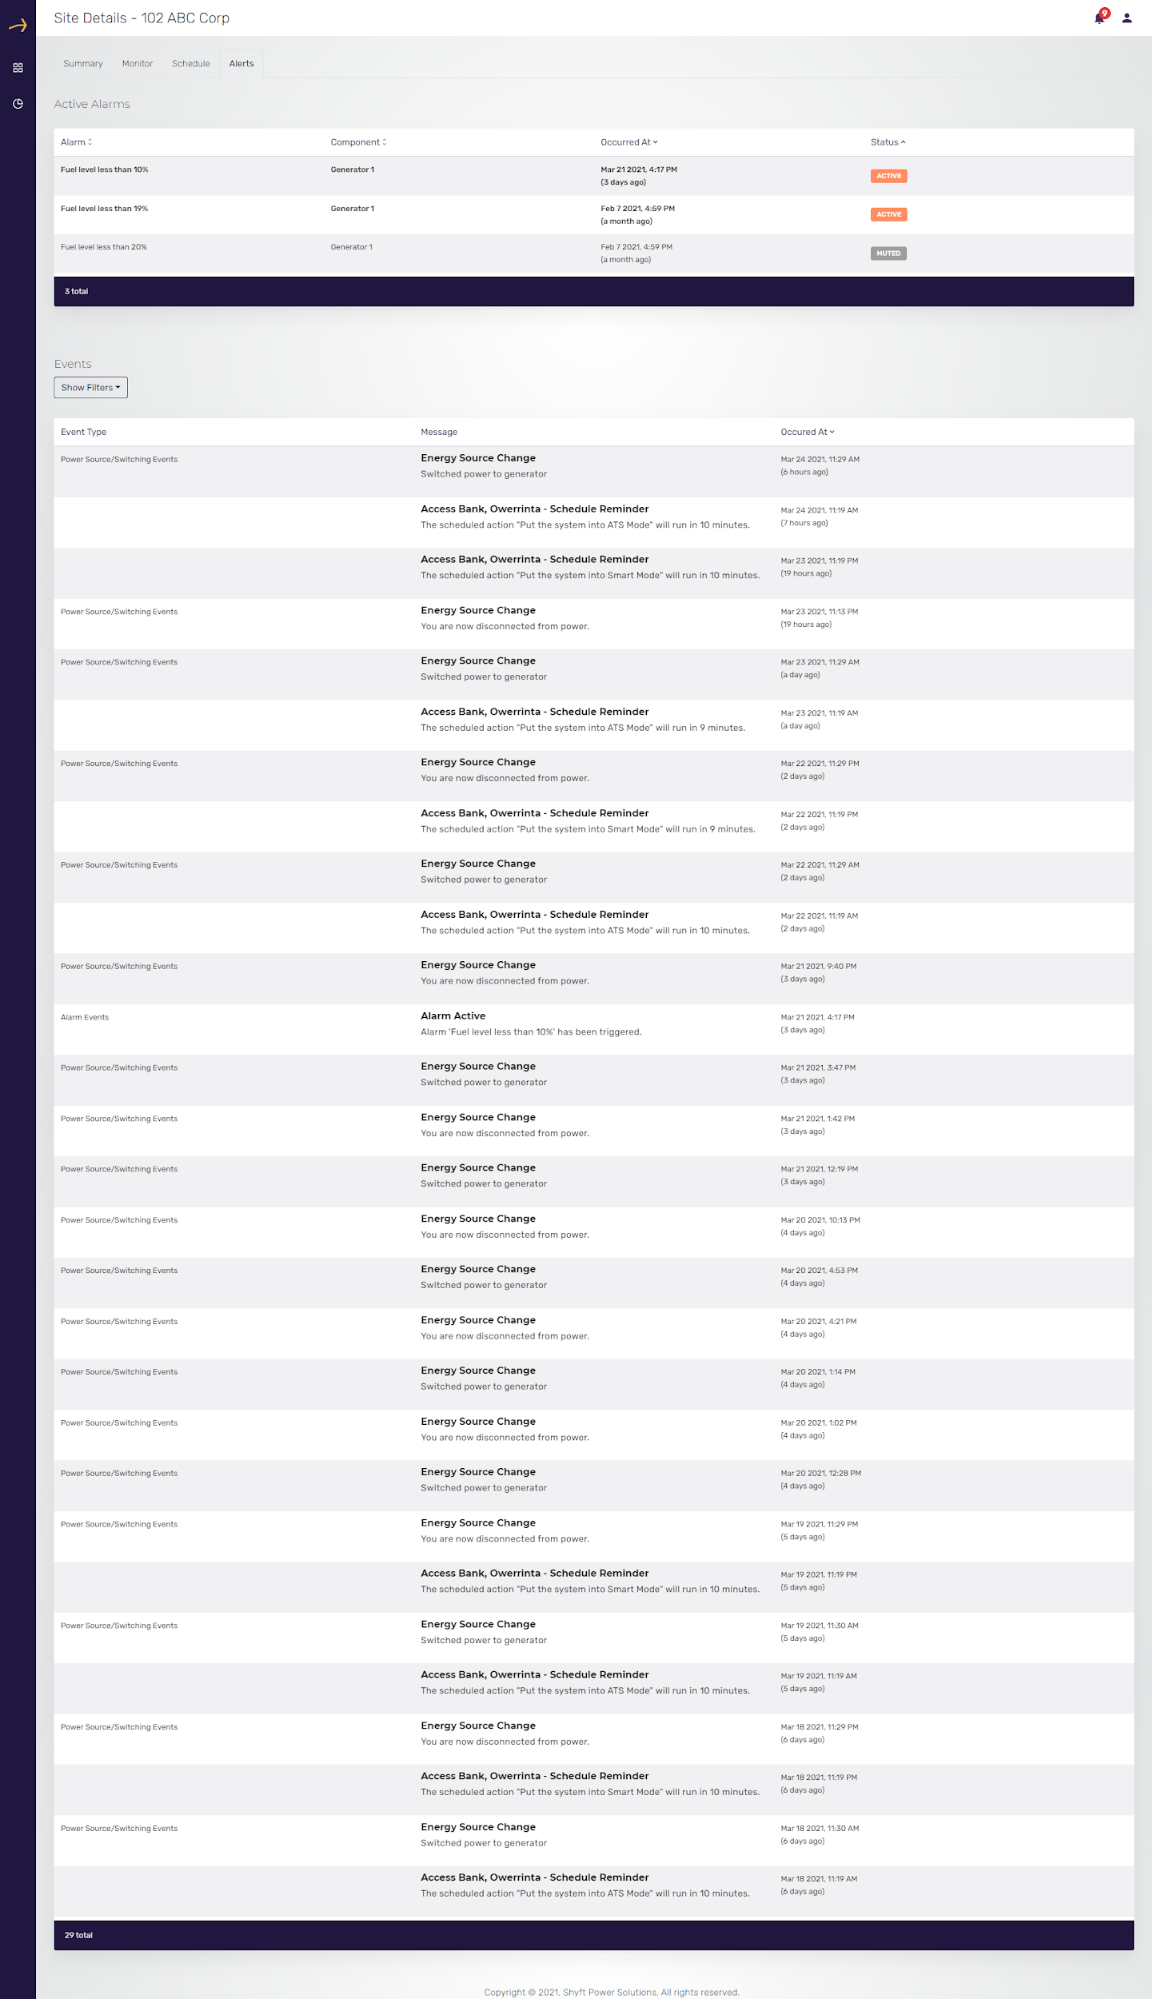
This is the last tab in the site dashboard. This tab shows the active alarms and events related to the current site
This tab has two sections:
- Active Alarms
- Events
(5.1) Active Alarms

This section displays the alarms related to the current site. There are four columns in the active alarm list:
- Alarm: It displays the actual notification message about which the alarm is. For example Fuel level in the generator.
- Component: It displays the component about which the alarm is being displayed. For example Generator, Battery etc.
- Occurred At : This column displays the date and time when the event occurred on which the alarm is set.
- Status: This column displays the status of the alarm whether it is active or muted.
(5.2) Events
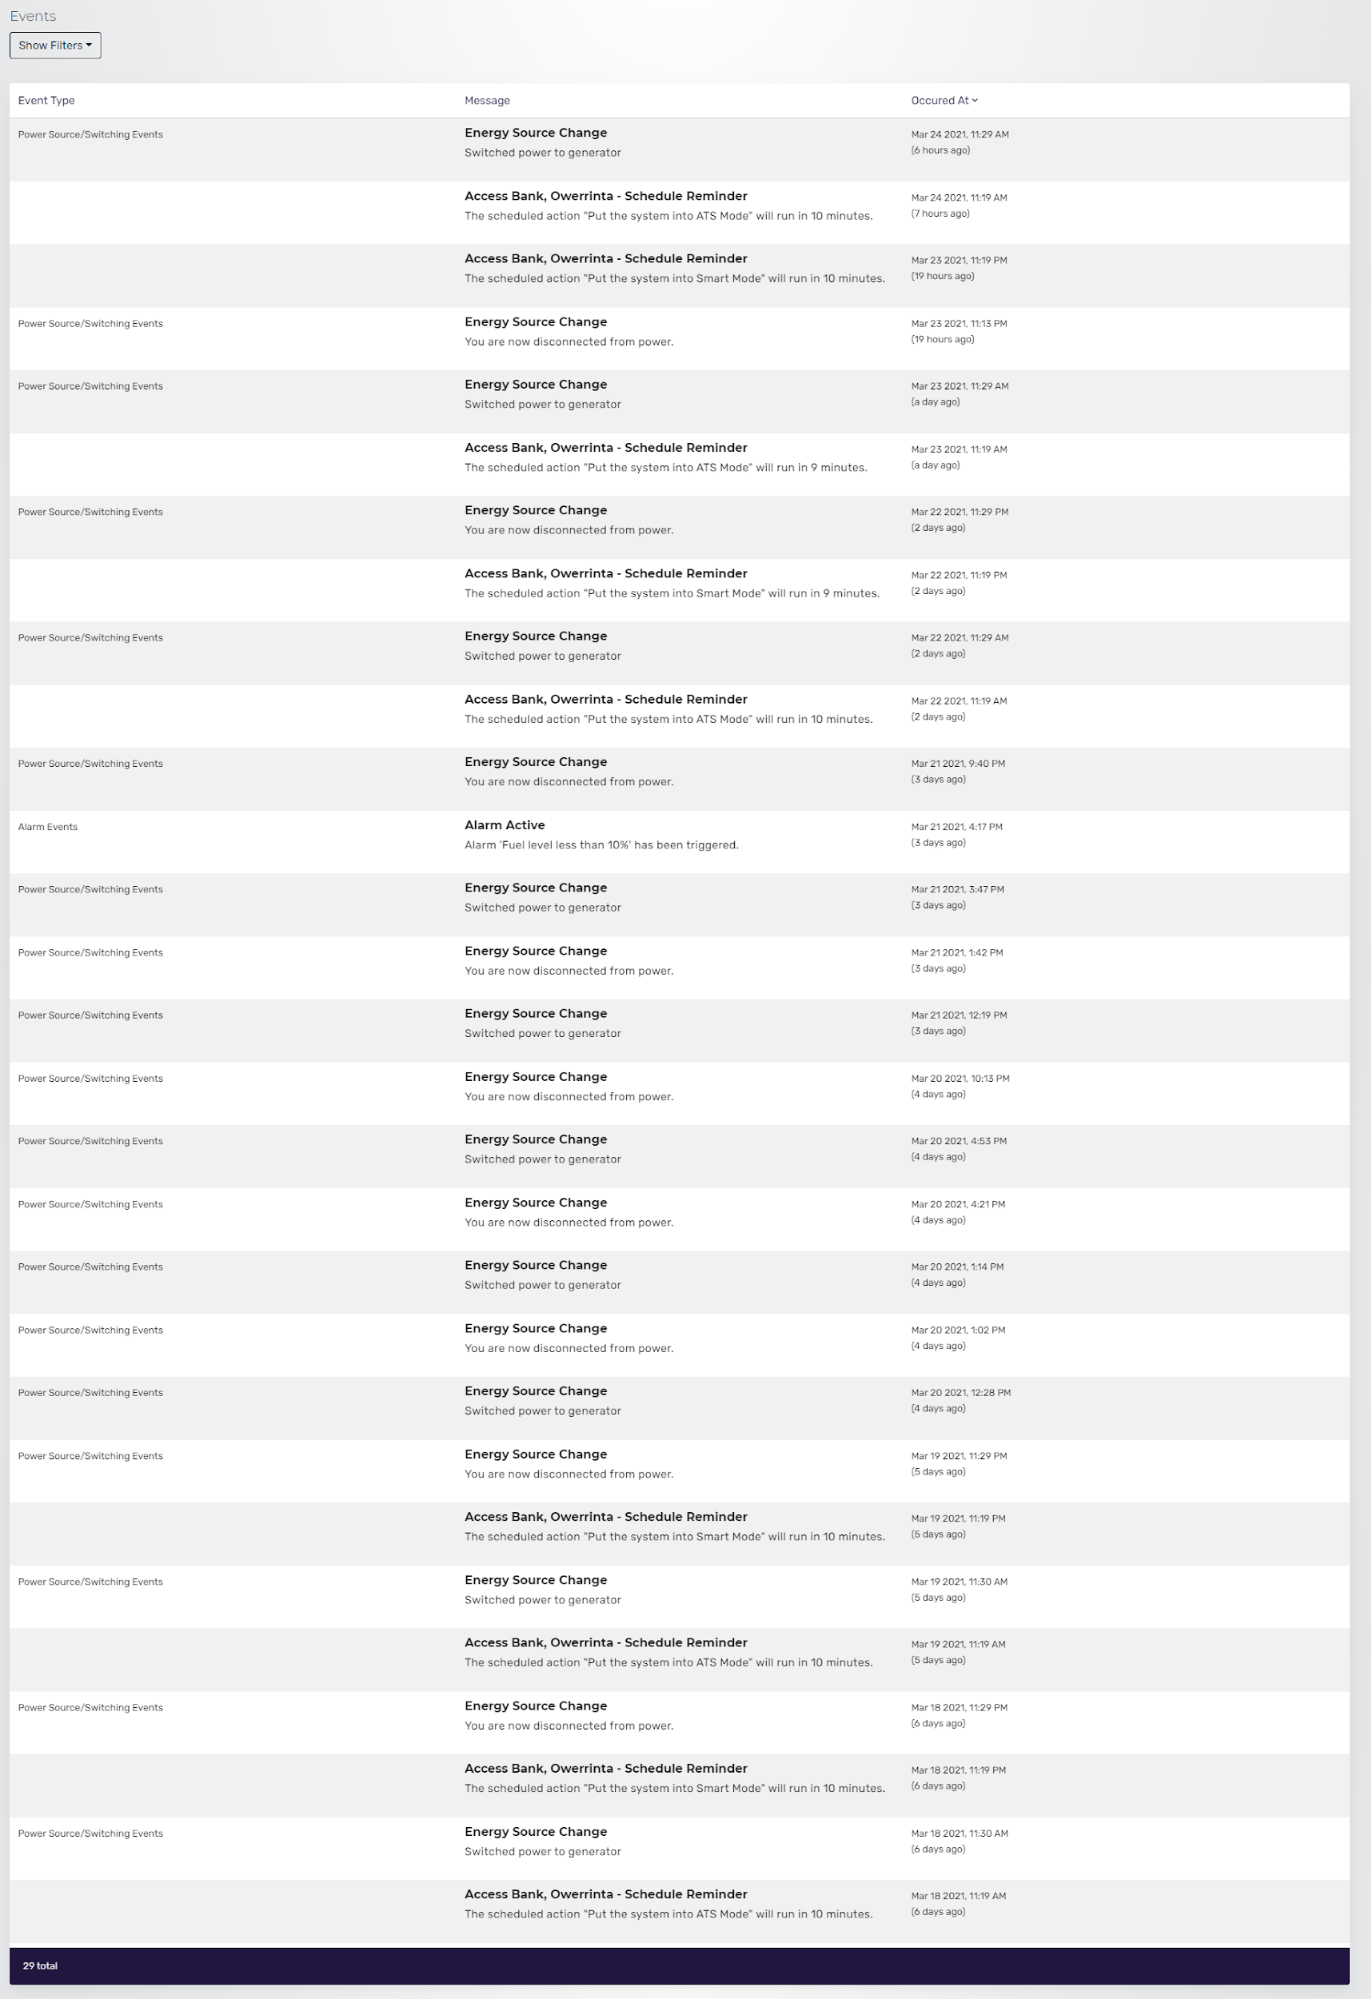
This section displays the events history for various jobs. For example Energy source change, Schedule reminder etc.
This report has three columns:
- Event Type :This column displays the type of the event like power switching events, alarm events etc.
- Message : This column displays the actual message about the occurred event like “Switched power to generator” in case of Energy source change and “Put the system to ATS mode” in case of scheduled actions
- Occurred At : This column displays the date and time at which the respective event occurred.
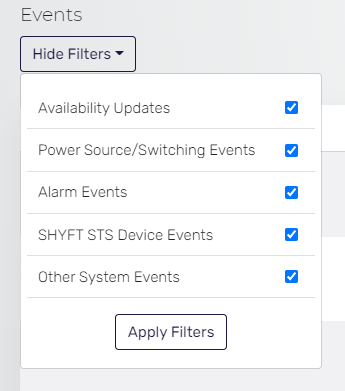
This section also has a dropdown checkbox list to apply filters based on various events like “Availability Updates”, “Power Source/Switching Events”, “Alarm Events”, “SHYFT STS Device Events”, “Other System Events”. For applying the filters users need to select the respective events from the dropdown checkbox list which they want to see. Please check the related screenshot above:
Comments
Please sign in to leave a comment.