NOTIFICATIONS:
On the SHYFT power application, you can turn on and off email notifications for various events. To manage that please follow the below-mentioned steps:
- Login to SHYFT power dashboard.
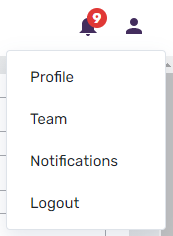
- Click on the user icon available on the top-right corner as shown in the below screenshot:

- The above action will open the dropdown menu with various options.
- Click on the “Notifications” menu item.
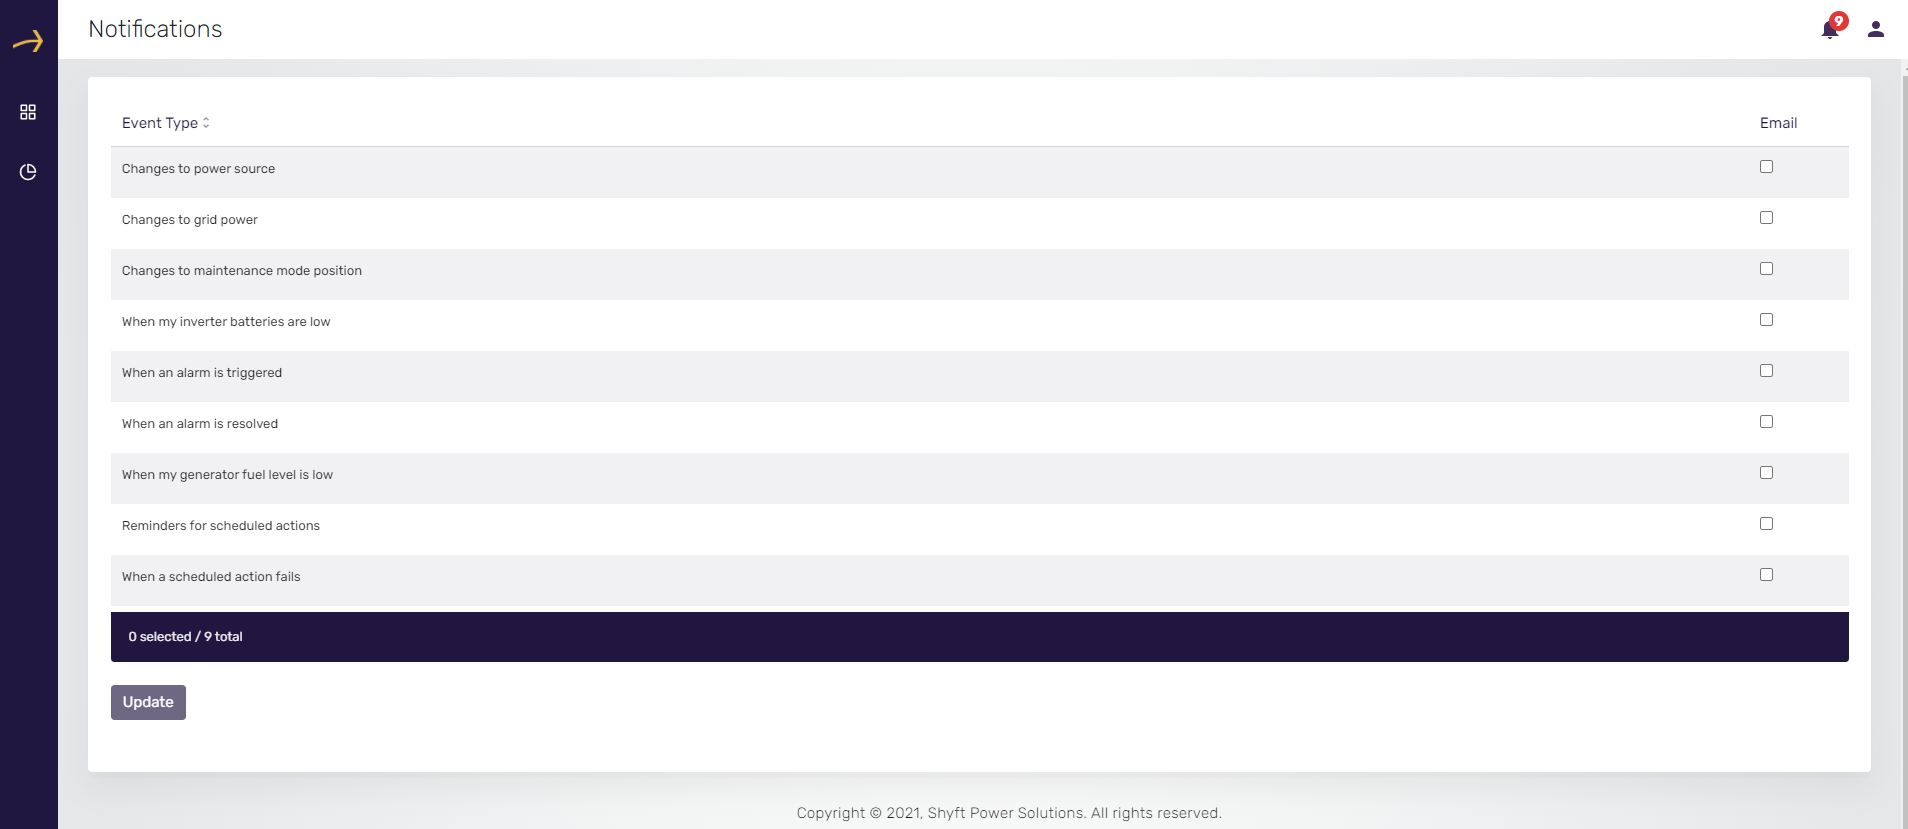
- It will open the Manage Notifications page as shown in the below picture.
- Here you can turn ON the email notification for the respective event by clicking on the provided checkbox in the Email column.
- You can enable/disable email notifications for the following events:
7.1. Changes to the power source
7.2. Changes to grid power
7.3. Changes to maintenance mode position
7.4. When my inverter batteries are low
7.5. When an alarm is triggered
7.6. When an alarm is resolved
7.7. When my generator fuel level is low
7.8. Reminders for scheduled actions
7.9. When a scheduled action fails

Active Alarms:
On the SHYFT power dashboard, you have easy access to active alarms as a Bell icon on the top right corner before the user profile icon. Please check the below screenshot:

The bell icon also shows the number of active alerts in a red color circle.
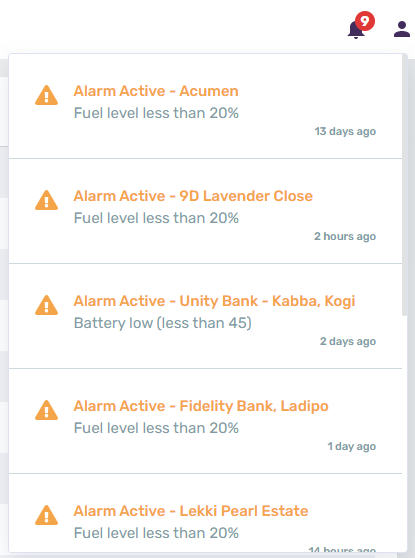
You need to click on the bell icon to see the list of active alerts as shown in the below screenshot:

In the alerts window, as shown above, you can see the active alerts of various events of the respective sites for example Fuel level.
Alerts Table

On the SHYFT Power dashboard, you have got the feature to get active alerts based on various parameters like Fuel level of the generator, Battery low of the battery bank etc. This feature is helpful to take timely action in advance to prevent various issues from happening. To navigate to the Alerts list, you need to login to the SHYFT Power application and go to the dashboard. There you can see a tab named “Alerts” next to the sites table. Clicking on the “Alerts” tab will bring the active alerts related to the various sites.
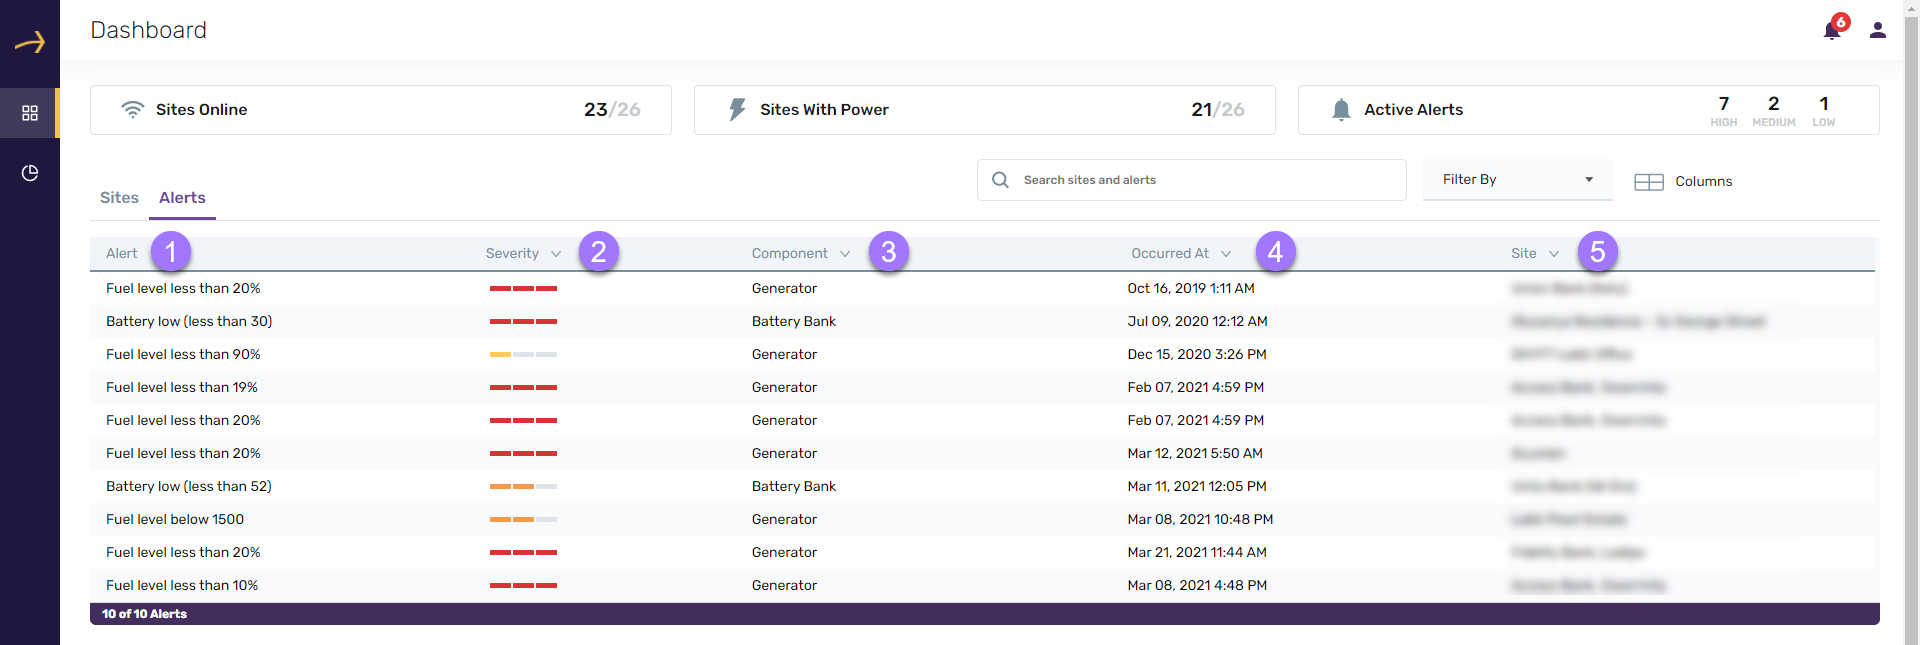
Here are the various columns that are displayed in the alerts table:
- Alert: This column shows the actual notification whether the alert is about Fuel level, Battery low etc.
- Severity: This column shows the severity of the alert based on colors and bars. For the highest severity, it shows three bars in Red color and for the lowest severity, it shows a single Yellow bar. There are three colors of these bars:
Red: Used for highest severity
Orange: Used for moderate severity
Yellow: Used for low severity - Component: This column displays the name of the component which is being impacted and about which the alert is being displayed.
- Occurred At: This column displays the date and time of the alert notification.
- Site: This column displays the name of the respective site about which the alert is being displayed.
Comments
Please sign in to leave a comment.